

Casey Bates is the founder and CTO of ThinkFox AI, where he builds agentic AI tools and teaches teams to use them.
What are the best OCR models for my documents?
Understanding OCR vendor benchmarks is confusing, and making sense of how a specific OCR model may perform on your own documents can feel even more daunting. Benchmarks tend to be noisy and often favor the vendor. Even worse, vendor benchmarks can be difficult to apply to your own documents. How can you trust a benchmark if you can’t evaluate it against documents like yours?
In this post, I’ll break down how to interpret benchmarks and understand what caveats to consider when identifying leading OCR models for your use case. I’ll use Datalab’s open benchmark, OmniParseBench, to understand how various OCR models, not just Datalab’s, perform against each other.
But wait, isn’t OmniParseBench a vendor benchmark from Datalab? Yes, and Datalab is the first to tell you to be skeptical of vendor benchmarks:
We built this benchmark, and we sell a parser - you should keep that in mind, just as you should with ParseBench. The difference we’re aiming for is that you don’t have to take our word for anything. Every test has a recorded source, and the scorer is about 2,000 lines of plain Python you can read.
And as always: the best benchmark is your own documents. Run your own evals.
— Vik Paruchuri, founder and CEO of Datalab, in Why we built OmniParseBench
So how can you trust it? Datalab built OmniParseBench to be fair, auditable, and comprehensive. The code and the data are available for you to inspect. Let’s see how it works.
What is an OCR benchmark and what is an OCR evaluation?
So what exactly is an OCR benchmark? And what is an OCR evaluation? A parsing benchmark compares OCR models by producing a score for how well their output matches the ground truth, including checks and reference outputs, across a shared set of documents. Sometimes benchmarks also handle preprocessing (setup) and postprocessing (cleanup) so that models are scored fairly on how they read the documents instead of the format they use in their output.
What makes up a score varies between benchmarks, but may include text presence, text order, table contents, table structure, and layout. We’ll cover what an OmniParseBench score is made of in the next section. Benchmarks can be useful for narrowing your choices, but be skeptical of vendor benchmarks because they often favor the vendor that created the benchmark.
When I discussed OCR benchmarks for this post with Paul Scemama, Research Engineer at Datalab, he shared how Datalab thinks of benchmarks, which I’ve laid out in the table below.
The four pieces of a benchmark: task, dataset, predictive models, and scorer
| Piece | What it is |
|---|---|
| Task | Extracting data into a fixed schema? Transcribing what’s on a page into Markdown or HTML? What is the shape of the input and output? |
| Dataset | A collection of inputs along with metadata and ground-truth signal for each input that can be used to judge a prediction (not always expected output). |
| Collection of predictive models | A system that produces outputs for inputs that try to do the task. |
| Scorer | A way of judging predictions against the ground-truth signal. |
How Datalab defines a benchmark: a task, a dataset with ground-truth signal, the models that attempt the task, and a scorer that judges their predictions. Each definition is quoted from Paul Scemama, Research Engineer at Datalab, by email.
Note that this post focuses on understanding document parsing benchmarks rather than data extraction benchmarks. If you’re interested in a deeper explanation of data extraction, check out my recent post Data extraction vs parsing: Which to use?, and take a look at Datalab’s open extraction benchmark, OmniExtractBench.
An OCR parsing evaluation, or eval, tests model parsing accuracy on a sampling of your documents, using tests that you write. Evals are useful for selecting the right OCR model for your document types, and for determining what types of mistakes the models can make.
The diagram below compares benchmarks and evals in more detail.
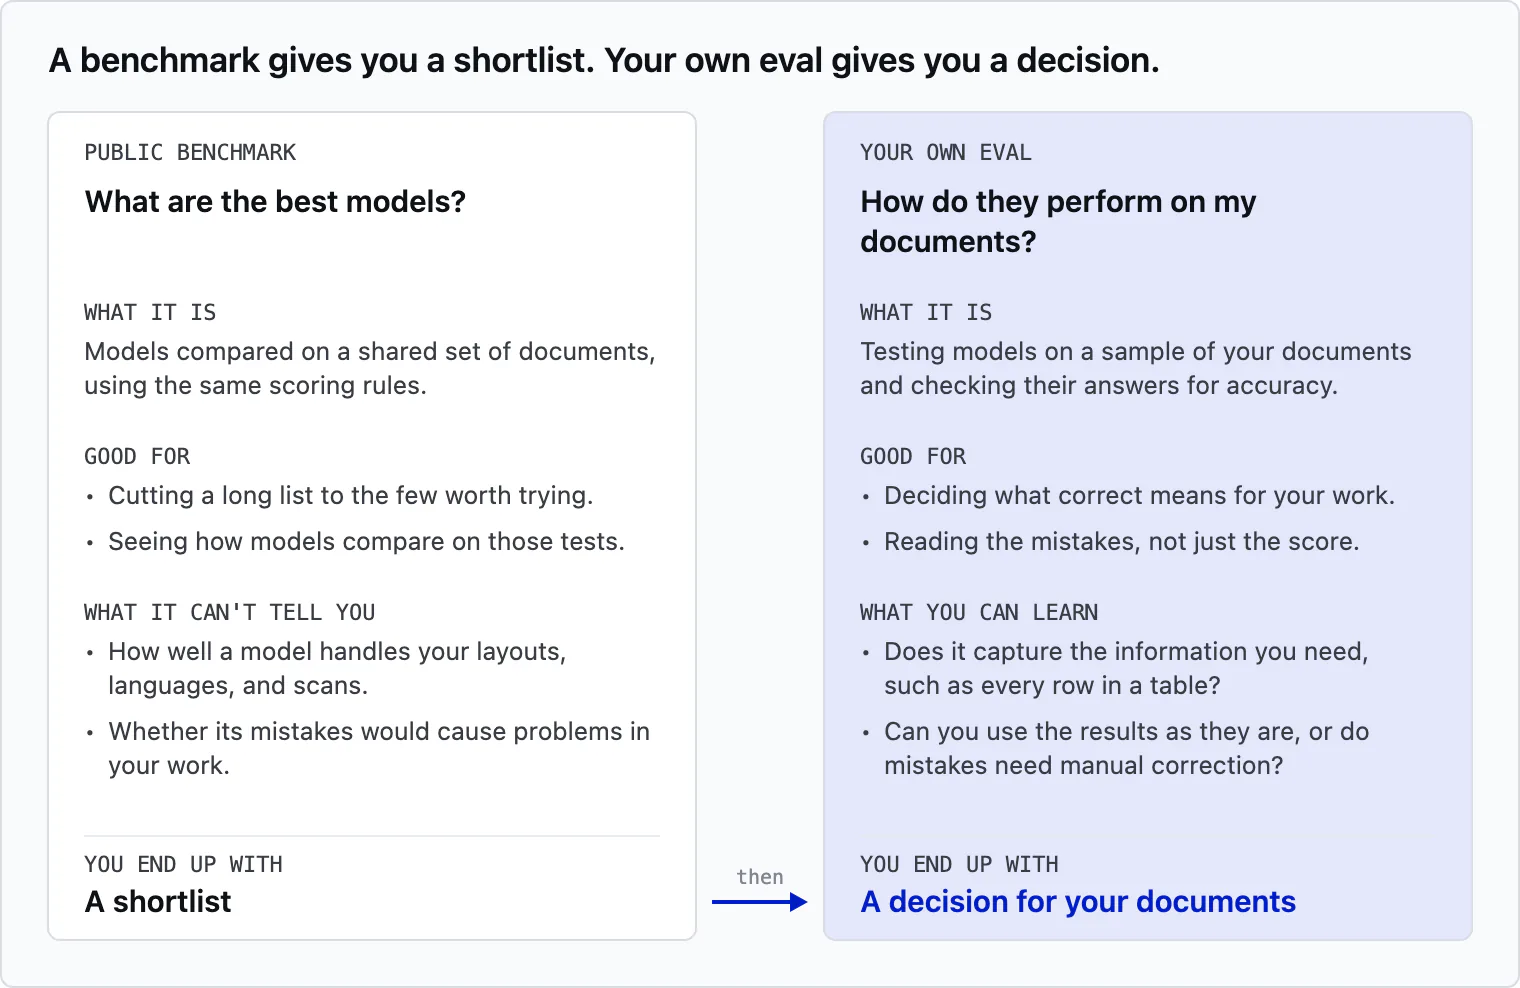
Sources: Datalab Benchmarks + Evals (2025-12-09); We lead an external extraction benchmark (but run your own evals) (2026-07-14).
Use benchmarks to narrow your choices, and evals to make the decision. With OmniParseBench you can build your own evals against documents you choose.
How is an OCR benchmark scored?
Now let’s look at what can influence or determine a benchmark score. I find it helpful to think of it in two parts as shown in the figure below: what is asked, and how it’s counted. Within these two parts there are seven categories, or factors, that decide a benchmark number.
What is asked refers to decisions that shape the corpus, like which documents are selected, how many, and what type. The task refers to what the OCR system is asked to produce during the run. And the ground truth is the answer for each eval, or test. Collectively, these are the factors to consider when asking “do the task and dataset of the benchmark reflect my operational use case?”
The second part covers how the results are counted, or “what does the headline number mean?” In other words, it’s how the benchmark actually scores predictions versus ground truth, and how easy it is to filter and rerank based on dimensions of the data, errors, etc.
But in my view, there’s one factor that influences both what’s asked and how it’s counted: the harness. The harness, or the code and configurations used during the eval, can influence what is asked of the model by enabling or disabling OCR features, or specifying parameters like temperature. The harness can also determine a benchmark number when the results are processed. So, the harness is the preprocessing (setup) and postprocessing (cleanup) that can affect a benchmark score.
Moving on, the metric used for a test can influence how an answer is scored. For example, certain vendors may create metrics tailored to how their OCR models format results. Roll-up, or aggregation of results by category, like handwriting or math, can influence the benchmark score. And when there are groups or families of results, how each is weighted may decide the score.
Finally, there’s the denominator. Should failed pages count? For example, if a model refuses to process an image because of a content flag, do you count that as a failure or ignore its result?
The figure below isn’t meant to be exhaustive, and it’s not from Datalab. It’s my own mental model of what influences a benchmark number. As you read through this post, consider if you envision this differently.
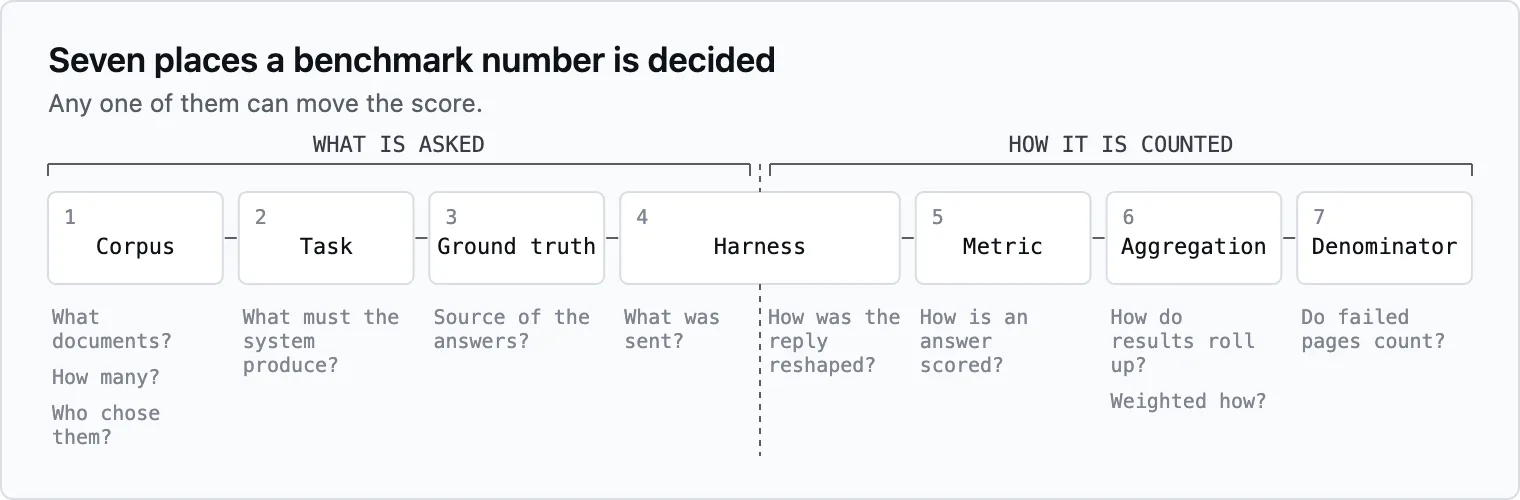
What is asked on the left, how it is counted on the right, and the harness on the line between them. The framework is mine.
Now that we have a mental model of factors that determine a benchmark number, let’s look at how a benchmark score is calculated. Benchmark scoring methods vary, so we’ll illustrate Datalab’s OmniParseBench scoring approach.
OmniParseBench scores average, or calculate the mean, from three main groups called families. These are text, tables, and layout. Families represent a logical grouping of test types. For example, the text family includes tests checking for presence of a value, order of values like “today is” coming before “Wednesday,” or repetition, which counts how many times a specific line appears. The three families are weighted equally and, when averaged together, are called the “headline.”
Benchmark families being weighted equally means that adding more tests to a family that’s most relevant to you, let’s say tables, makes the table score more precise, not count more.
One of my favorite features of OmniParseBench is tagging, which is useful to select and filter tests most relevant to your use case. For example, what if the set of documents you want to evaluate doesn’t contain handwriting? With OmniParseBench you have the option to remove only the handwriting tests from the evaluation set.
An important thing to know about OmniParseBench tags is they never decide if a specific test passes or not, and they won’t determine the headline metric.
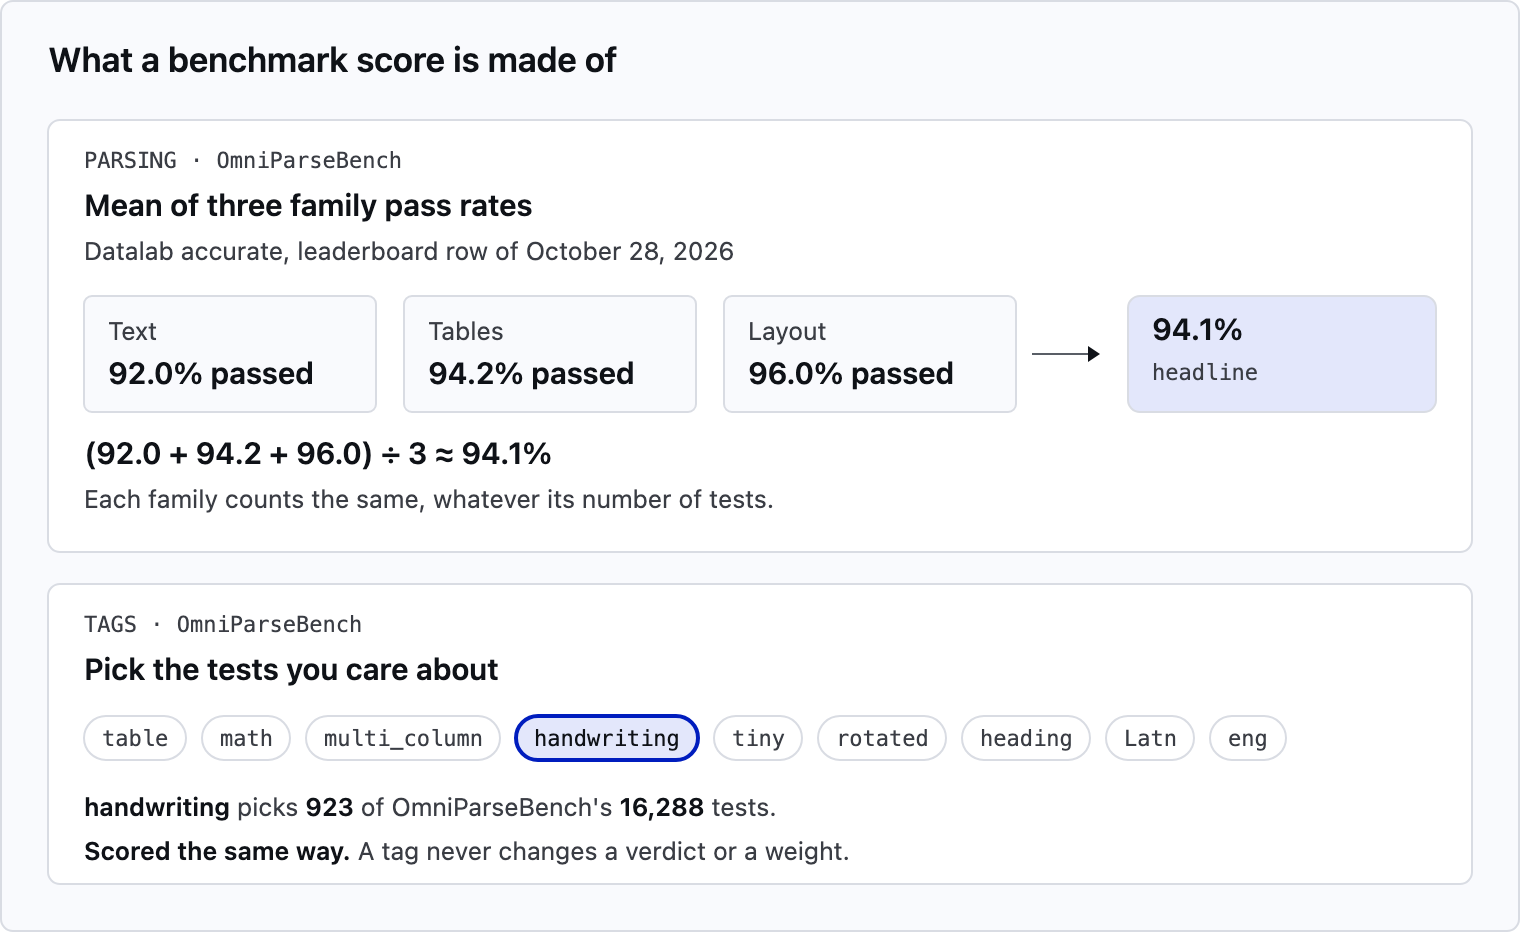
A parsing headline is the mean of three family pass rates. Tags pick tests and never change a verdict. Sources: OmniParseBench: a clear, auditable and explorable benchmark for OCR (2026-10-08); the OmniParseBench leaderboard as of 2026-10-28.
Another feature of OmniParseBench that I appreciate is the use of unit tests where each test answers a yes or no question about a page. There are other ways of scoring, like scoring edit distance between a model’s output and the ground truth. But I build my own evals with unit tests, like is this word present, or is this value present under this heading (which we’ll see an example of later in this post), because the test results are interpretable and writing unit tests is scalable.
What makes an OCR benchmark useful?
Knowing how a benchmark is scored is one thing, but understanding what makes a benchmark useful to you is another. A benchmark is useful to you if it represents how the OCR models perform on your specific data and tasks. So for a benchmark to be useful it needs to be auditable, and it should be honest about how it measures OCR performance, and on what data. This means:
- The dataset needs to be diverse and adequately tagged.
- The preprocessing (setup) and postprocessing (cleanup) by each harness need to be consistent and fair for each OCR model being evaluated.
- The scoring should give strong signal for task success.
A notable tension with OCR benchmarks is that the specific data and tasks that shape the usefulness of a benchmark vary by user, and the headline score is an opaque, aggregated number that averages the details out.
For document parsing, there are many ways to slice data. A single OCR benchmark may be evaluating any or all of the following:
- Text presence
- Text order
- Table transcription
- Table headings
- Headers and titles
- Math equations
- Language
- Layout
The list goes on. Datalab tries to address this tension through the OmniParseBench tagging we saw earlier because of the control tagging gives users for shaping the data and tasks being evaluated. From this, users can get a better signal from the benchmark result. Also, making OmniParseBench modular and open-sourcing the code enables users to build evals, and even edit the code.
How do I read a vendor’s OCR benchmark?
Now that we have an idea of how a benchmark number is decided and what makes it useful, let’s use this knowledge to better understand four major ways that OCR model vendors can build benchmarks favorable to them.
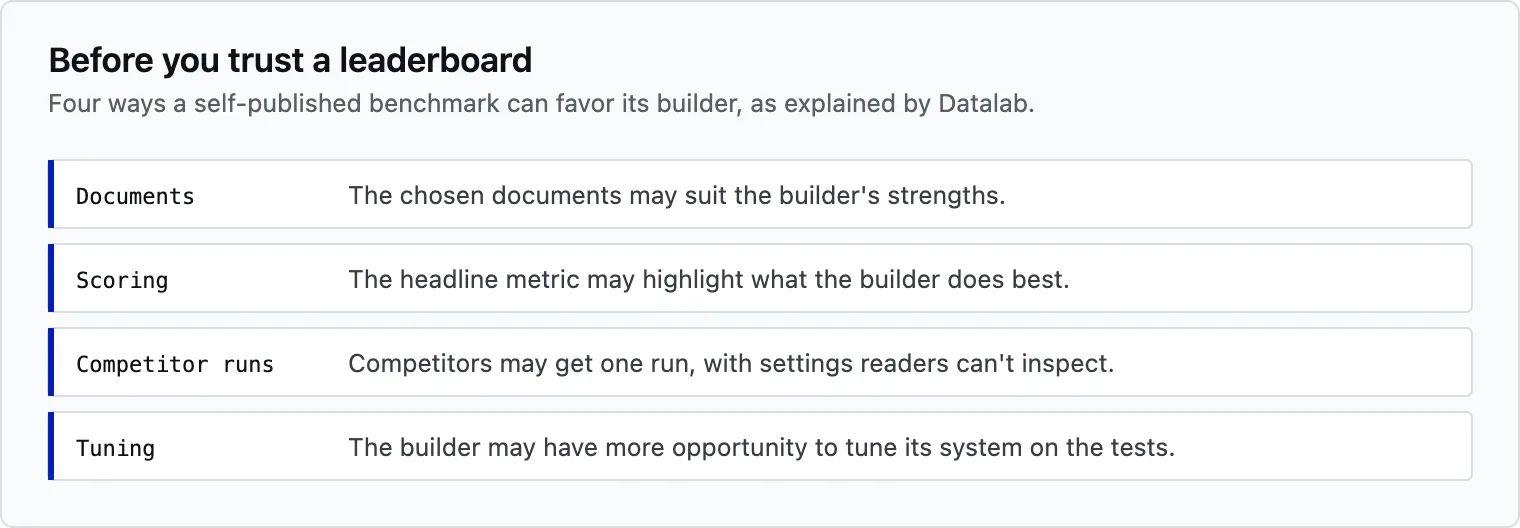
Four ways a self-published benchmark can favor its builder, adapted from Datalab’s own list. Source: We lead an external extraction benchmark (but run your own evals) (2026-07-14).
Vendors may select documents or tailor the headline metric to their strengths, limit competitor runs during evals, or tune their AI systems on the benchmark tests. Usually only one metric is provided per AI system being evaluated. But what if the benchmark had drawn from a different set of documents?
A leaderboard score is a measurement, and every measurement has an error bar. Datalab published the real results for every run on the leaderboard, with its pass or fail verdict recorded. So I used this information to run a simulation and add an error bar.
A benchmark number may come from a test suite that runs only once, but you can use a statistical technique called bootstrapping to estimate how the benchmark scores vary if a different draw of documents from the same pool were used for the benchmark. So I ran a bootstrap of the 2,343 OmniParseBench document indices, drawing 2,000 lists at random with replacement (some documents appear twice in the draw and others don’t appear at all). With each draw I recalculated the headline score. Completing 2,000 draws gives 2,000 simulations per OCR model, without needing to make real API calls. The chart below shows the middle 95% for each AI system.
Think of it this way. If you’ve been tasked with reducing the latency of a feature in an application, you probably wouldn’t use the median latency results from one set of requests to ship. You’d probably record the median latency across several different sets of requests, each with its own median. A headline score is just one sample of “how good is this AI system at parsing documents like these.” Nobody ships on a single latency sample, so don’t pick an OCR model using a single leaderboard score.
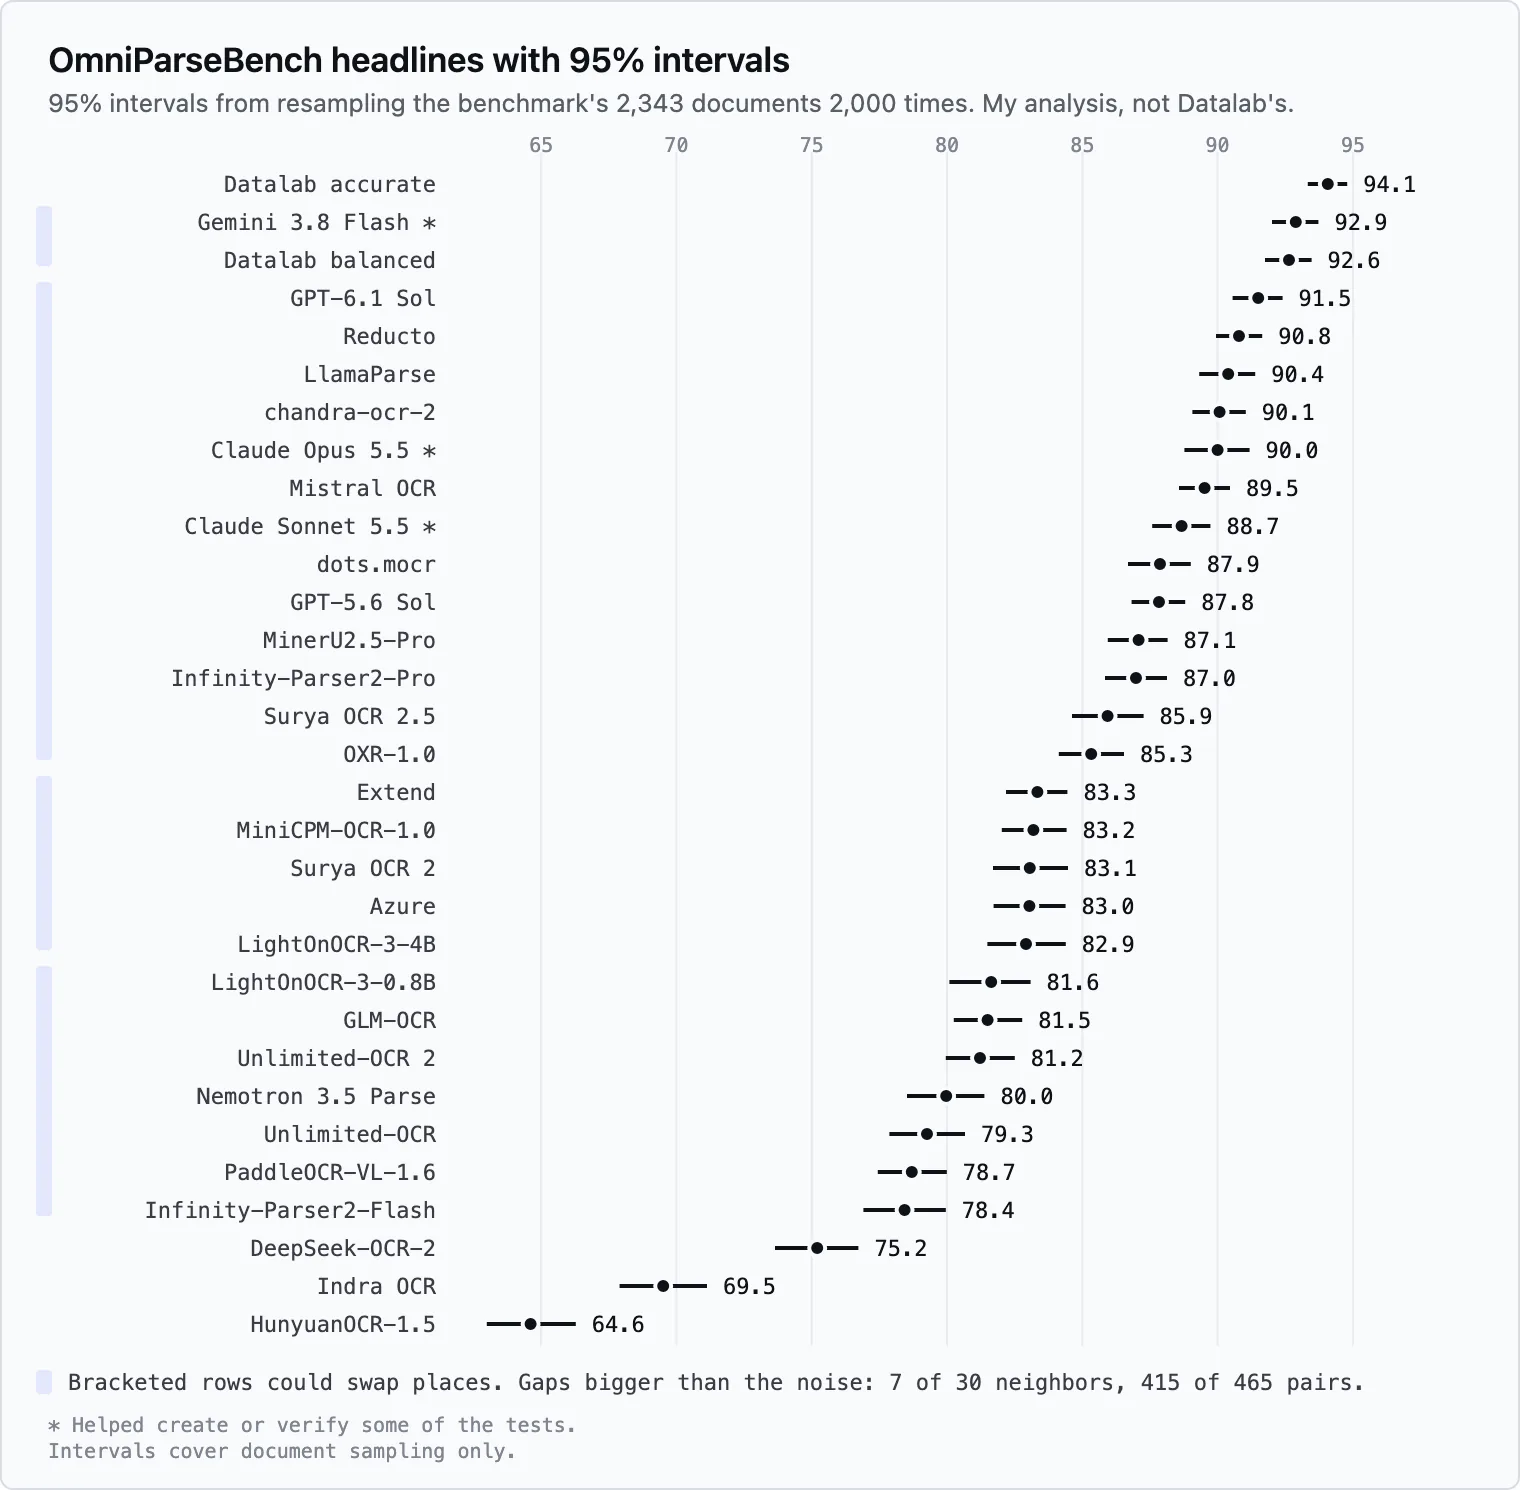
Each headline with the middle 95% from resampling the benchmark’s 2,343 documents 2,000 times. Three systems without a layout score are left out. Source: my analysis of the published verdicts, OmniParseBench dataset as of 2026-10-29.
Each headline score varies about 0.7 to 1.7 points either direction. That’s the noise. Now take a look at the gaps. Of the 30 places where one system sits directly above the next, only 7 of those gaps are bigger than the noise. The other 23 system pairs could swap places on another draw. Comparing any two systems, not just the systems next to each other, shows that most gaps are real because 415 of the 465 possible pair combinations are bigger than the noise. So you can think of the leaderboard as tiers, not as a strict order.
Keep in mind that the error bars above cover document-sampling noise only, not variation from run to run.
Be skeptical anytime a vendor benchmark places its own OCR models as the leader. Datalab places in the top tier here, which is why it matters that the data and scorer are public. And be wary anytime a leaderboard shows top scores above 99% because it could mean the benchmark favors the vendor, the evaluations are too easy, the benchmark is saturated, or some combination of all three.
To summarize, when reading an OCR benchmark, consider if the dataset contains what you care about. If so, then consider if and how the scorer, or scorers, provide fair and meaningful signal to measure task success. You may need to look at the code to see if the benchmark and its harness handle preprocessing and postprocessing fairly. Finally, consider if the benchmark enables you to filter on tags that you care about and then rerank.
Now let’s take a deeper look at test failures to understand how a scorer might fail a test.
What does a test failure look like?
Let’s see an example of a test failure. The figure below shows twelve tests for a single page of data, pulled from OmniParseBench. In the test on the first row, the test is looking for the value 4.0 a under the headings Ranger Russet (Trial 5) > RF. In this case the test is a table_cell test looking for a specific value to be returned under the specific heading values, which are Ranger Russet (Trial 5) > RF.
The correct value is returned for these headings by both Datalab balanced and Datalab accurate (highest-accuracy, higher cost), so the test passes for both Datalab modes. The same is true for eleven of twelve tests of values on this page. But test 9 fails. Why? I found the failure reason surprising, so I thought it would be a good example to share.
It turns out that Datalab balanced and Datalab accurate fail test 9 not because they failed to return the value 0.23 (they did), but because they failed to return that value along with the specified headings Désireé (Trial 2) > Eggs/cyst. Looking closely, the reason for the test failure is that the heading “Désirée”, the more common spelling with the accent on the penultimate “e”, was returned instead of “Désireé” which appears in the original source document.
So, the scorer’s reason for the failed test, that cells matching 0.23 were found but not under the headings Désireé ..., is true because Désirée ... was returned instead. These twelve OmniParseBench tests allow for zero edits, and this scorer is checking text character-by-character. This test was derived from publisher_markup, so the original content is the required answer. Nine of 34 systems fail only this test but pass the other similar tests on this page. The 21 systems that pass all twelve likely all kept the original spelling from the page. The other four systems failed several tests on this page.
What do you think, is changing Désireé to its more common spelling Désirée a feature or a bug? If you write your own tests, you can decide!
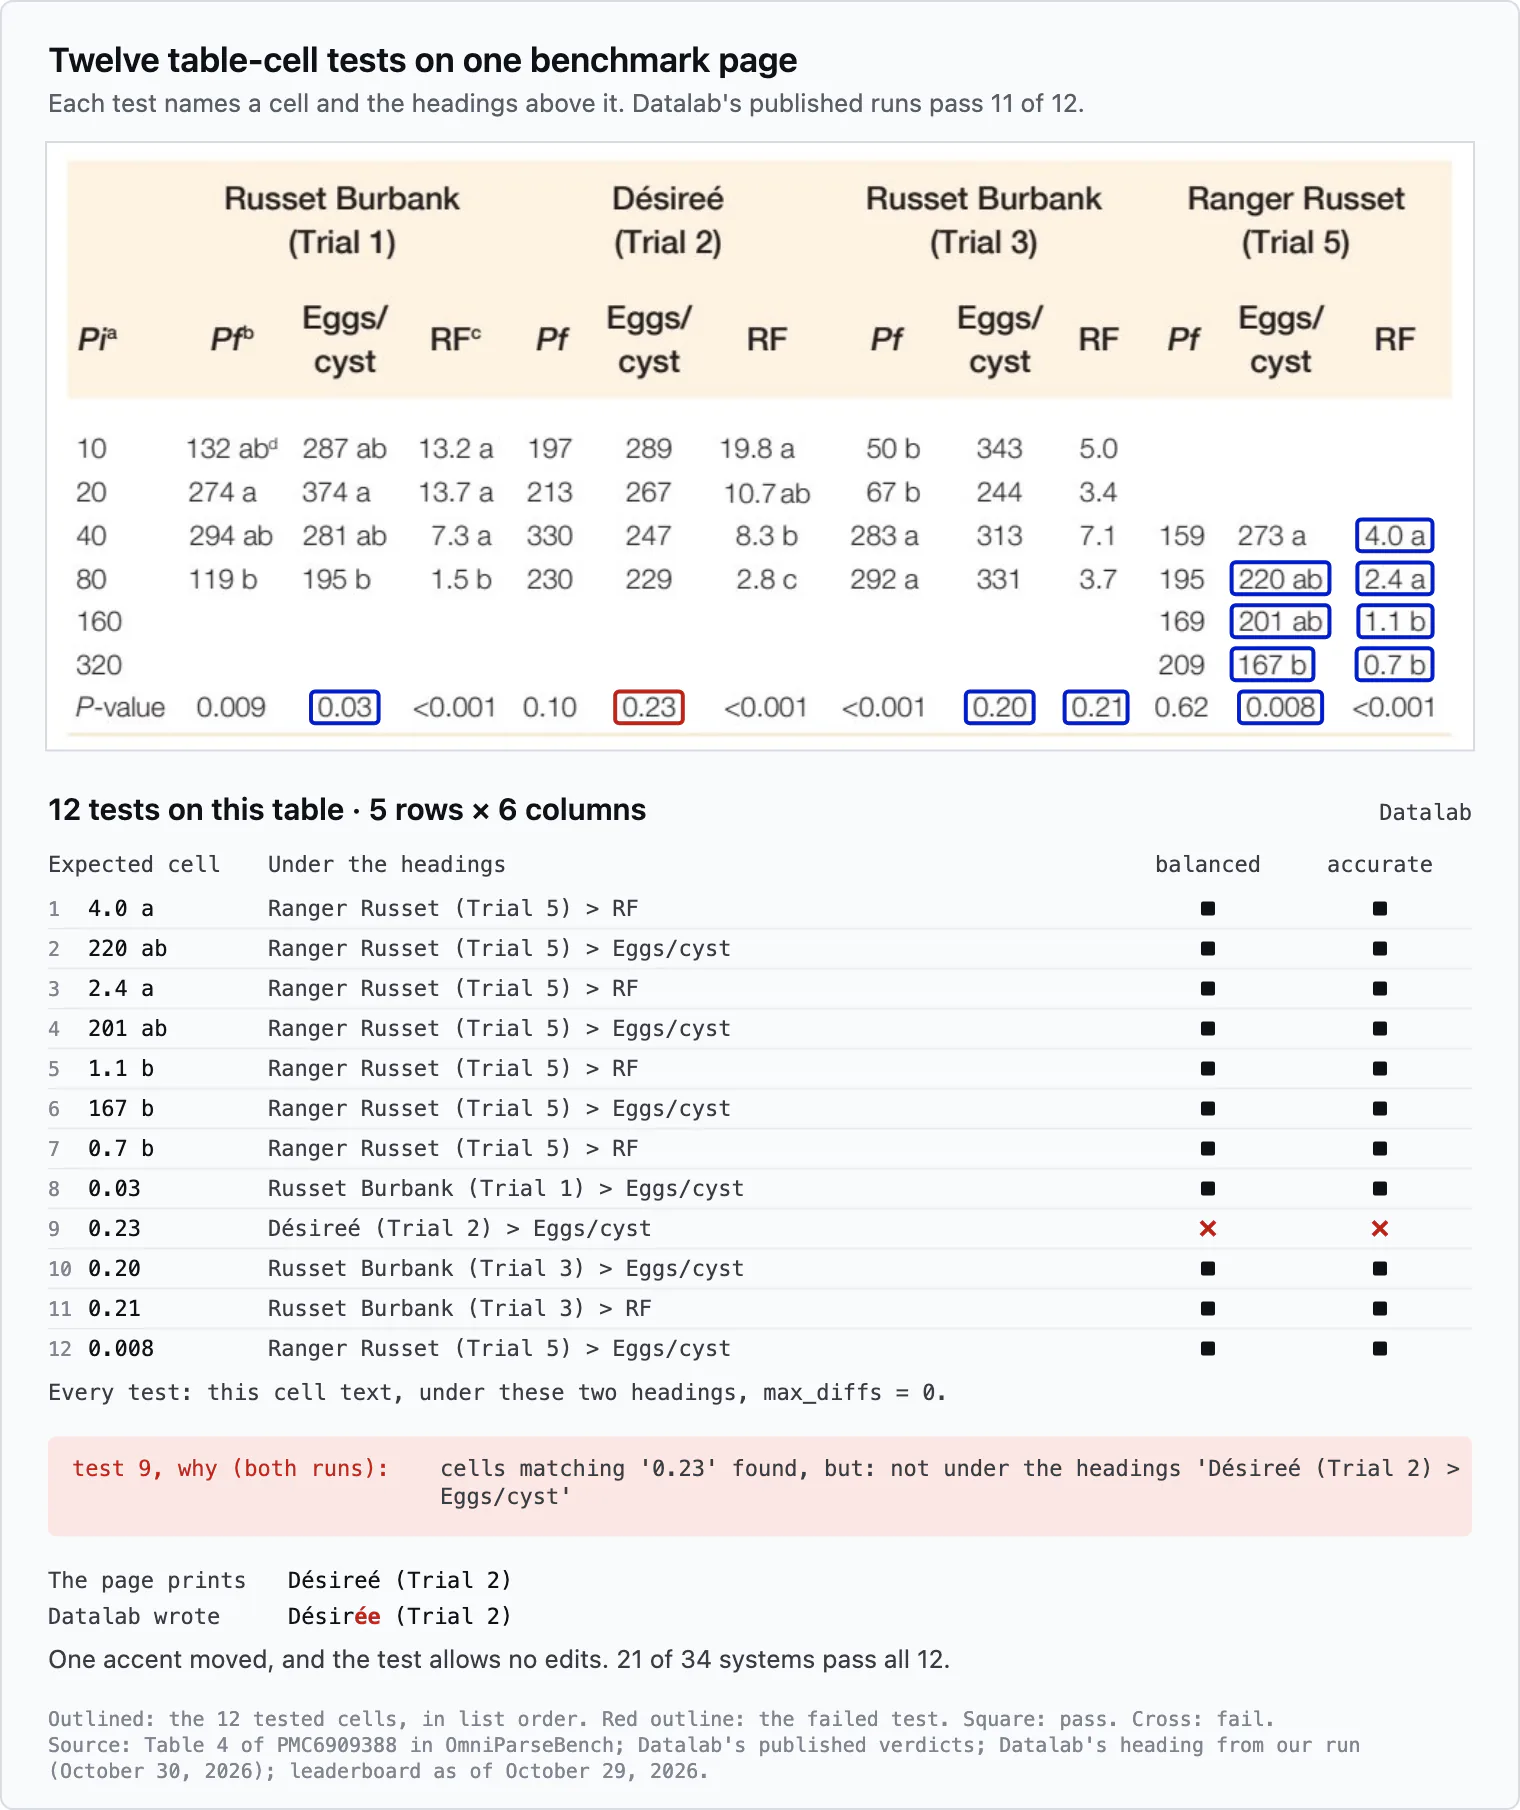
Twelve table-cell tests on one benchmark page, with Datalab’s published verdict on each. The 34 systems counted in the text include the three that have no layout score and so no headline. The one failure: the page prints “Désireé” and Datalab wrote “Désirée.” Sources: OmniParseBench dataset as of 2026-10-29; my run on 2026-10-30 for the heading Datalab wrote.
With an open and auditable benchmark like OmniParseBench, every test failure carries a reason that you can inspect and argue with. I won’t cover how to run your own benchmark here, but it’s worth mentioning that Datalab built OmniParseBench to be modular and extensible. With OmniParseBench you can bring your own documents, write your own tests for those documents, add your own model, or even add your own scorer.
OmniParseBench does have some limitations worth knowing about. For example, invented text isn’t penalized, 2.3% of the checked facts are wrong, and 225 tests depend on a header/footer rule that isn’t documented.
Conclusion
An OCR benchmark score from OmniParseBench is a collection of pass-or-fail judgments rolled up by rules. If you can read the rules and results, you can gauge if the benchmark is evaluating factors relevant to your documents. Does the headline score for a benchmark aggregate on test families that reflect what’s in your document corpus? And does the benchmark evaluate documents like yours?
A leaderboard score is one data point that usually doesn’t capture variation from run to run. Although bootstrapping can’t help you understand this run variation, it shows that OCR model performance groups by tiers, rather than simple ranks. Don’t trust ranks alone. Build your set of documents and write evals for them.
Frequently asked questions
What are the best OCR benchmarks for comparing document parsing models?
The olmOCR benchmark evaluates the ability of OCR models to convert PDF documents to Markdown while preserving context and structure. This benchmark tests OCR model abilities on text presence and absence, reading order, table accuracy, and math formula accuracy. The olmOCR-bench dataset contains 7,010 test cases across 1,403 PDF files. Datalab used some documents and tests from olmOCR-bench to build OmniParseBench.
What are the best open-source OCR models in 2026, and how do they score?
In a comparison of open-weight OCR models Datalab found the best overall models to be chandra-ocr-2, dots.mocr, MinerU2.5-Pro and Infinity-Parser2-Pro. For tables, MinerU2.5-Pro scored highest followed by dots.mocr. For both text and handwriting, chandra-ocr-2 leads followed by LightOnOCR-3-4B. On non-English pages, chandra-ocr-2 leads followed by dots.mocr and Surya OCR 2. Of the 15 models that returned layout boxes, 14 scored 89 or higher.
Which OCR benchmark should I use to test handwriting recognition?
The OmniParseBench benchmark from Datalab evaluates leading general-purpose AI models and OCR models alike on handwriting recognition. With OmniParseBench you can add your own handwriting examples and unit tests to evaluate OCR model performance on your documents. If you do not see an OCR model you want to test on the OmniParseBench leaderboard, the repository instructions provide guidance on how to run the evaluations against a model of your choosing.
Why do the same OCR models rank differently on different benchmarks?
The set of documents, or corpus, used in the evaluations is different for each benchmark. Benchmarks like olmOCR-bench and OmniParseBench use yes/no unit tests to determine if a test passes or fails. Unit tests mostly check content, but each benchmark has its own conventions. Benchmarks that use an evaluation method known as edit distance may evaluate OCR formatting performance, and vendors may tailor the evaluations to the formatting strengths of their OCR models.