Choosing a document parser usually starts with a leaderboard: one number per parser. It is difficult, however, to go a level deeper and understand where and how parsers fail or succeed.
We wanted a benchmark that is:
- clear: every test is a yes/no question about a page, every score is the share of tests passed, and every score comes with the number of tests and documents behind it, so a thin slice says it is thin and shows where to add tests next;
- auditable: every test records how its answer was established, and the scorer is open code with no model judging the outputs; and
- explorable: every test is tagged by what it checks, so any slice of the benchmark, like handwritten tables or Thai text, gets its own score.
Today we’re releasing OmniParseBench: 16,288 pass/fail tests on 2,937 pages from 2,343 documents, in 92 languages, with every test’s answer traced to its source. The dataset and the code are open.
olmOCR-bench showed that pass/fail unit tests are a simple and flexible proxy for parsing quality that anyone can check. But after using it since it came out, we’ve noticed it has gotten saturated, and what now separates the top systems is largely output convention and overfitting rather than reading. Its tests also each sit in one bucket, set by where its page came from, so a weakness on mixed content, like a handwritten table or an equation in a table cell, is averaged into whichever bucket its page landed in.
Another popular benchmark, ParseBench, splits parsing into five capabilities and gives each its own specific metric. Its scores don’t share a unit, so they can’t be compared or combined cleanly, and its tags describe whole pages rather than content. The multiple ways to judge created fairness and reliability issues with ParseBench scores.
Our benchmark
We follow olmOCR-bench in that we use unit tests in order to provide a proxy for real-world parsing performance. A test is a yes/no question about one or more pieces of content on a page. There are three higher-level concepts that describe a test:
- Its derivation: how it was verified.
- Its type: how it evaluates the content.
- Its tags: what kind of content it’s evaluating.
The design
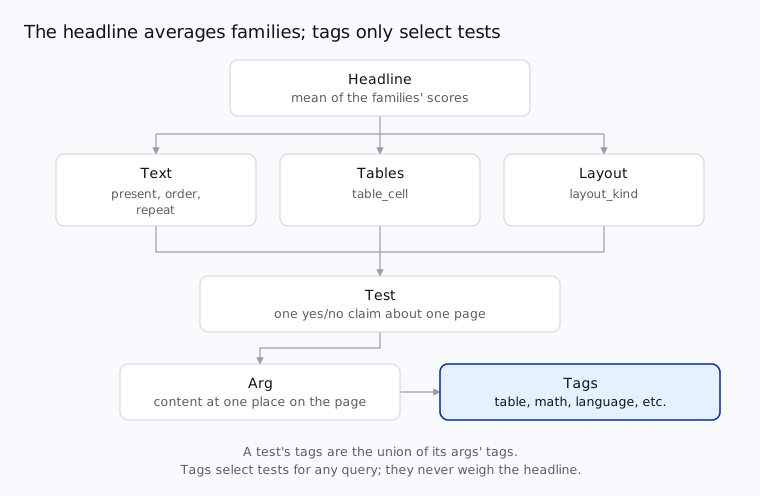
The headline is the mean of three family scores: text, tables and layout. Families are just a natural grouping of test types:
| test type | checks | family |
|---|---|---|
present | this text, number or equation appears | text |
order | text A comes before text B | text |
repeat | this line appears exactly N times | text |
table_cell | this cell sits under these headings and beside these neighbors | tables |
layout_kind | the block holding this line is a heading, text or table | layout |
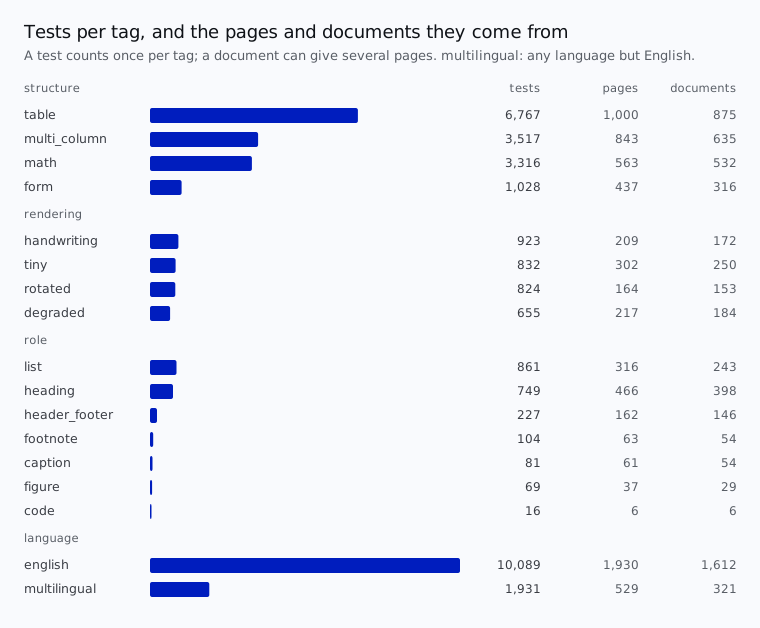
A test checks one or more args, each of which is the content at one place on the page. Each arg is tagged:
- structure:
table,math,formandmulti_column; - rendering:
handwriting,tiny,rotatedanddegraded; - role:
heading,caption,footnote,list,code,figureandheader_footer; - script: ISO 15924 codes (
Latn,Hani,Deva, …); and - language: ISO 639-3 codes (
eng,fra,tha, …).
Tags never determine the headline metric or if a test passes or not. Tags are created after a test is made and are for the purpose of querying tests you care about.
Data
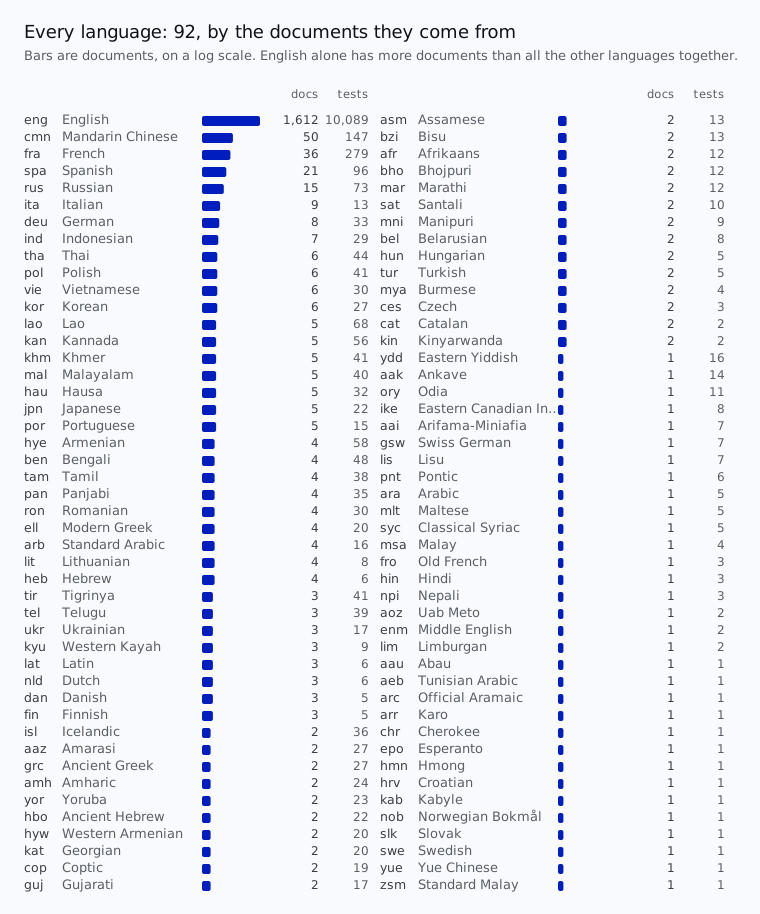
The dataset consists of 16,288 tests on 2,937 pages from 2,343 source documents from 22 suites.
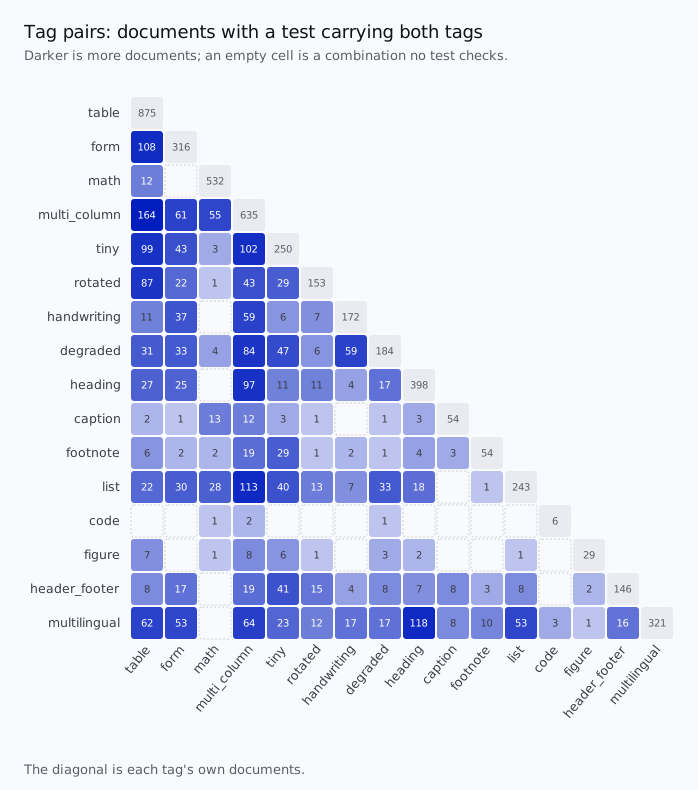
Tags combine. Here we show a sample of counts for pairs of tags, noting that a test can have an arbitrary number of tags.
Results
Every score here is based on the dataset in Hugging Face.
| parser | headline | text | tables | layout |
|---|---|---|---|---|
| Gemini 3.8 Flash* | 92.9 | 91.3 | 95.2 | 92.2 |
| Datalab accurate | 92.7 | 90.8 | 91.8 | 95.6 |
| Datalab balanced | 91.6 | 90.0 | 89.2 | 95.5 |
| Reducto | 90.8 | 85.4 | 91.2 | 95.8 |
| LlamaParse | 90.4 | 88.2 | 92.6 | 90.4 |
| Mistral OCR | 89.5 | 82.8 | 91.9 | 93.8 |
| Claude Sonnet 5.5* | 88.7 | 93.1 | 95.4 | 77.5 |
| GPT-5.6 Sol | 87.8 | 85.4 | 91.6 | 86.5 |
| Extend | 83.3 | 64.1 | 92.5 | 93.4 |
| Azure | 83.0 | 74.6 | 81.7 | 92.8 |
| Tesseract | none | 17.6 | 0.0 | unsupported |
* Used in creating and verifying at least some tests.
Exploring results
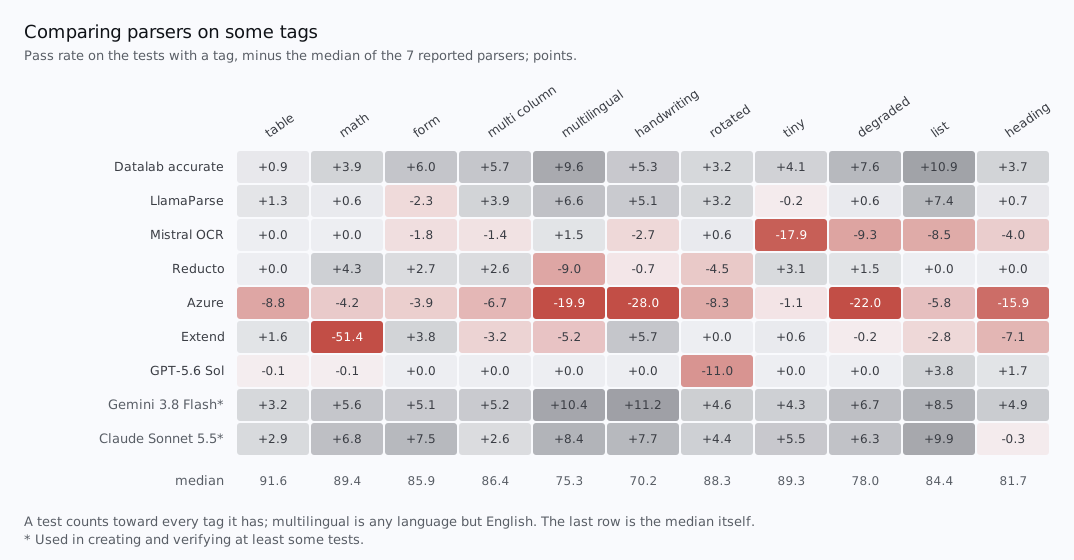
Pick test types and tags below, and each parser is scored on the tests you picked the way the headline is: the mean of its pass rates in each family. The scores come from the leaderboard’s runs.
Loading the tests…
To pick tests and aggregate scores your own way on your own runs, see the repository’s guide to querying results.
Accuracy against latency and cost
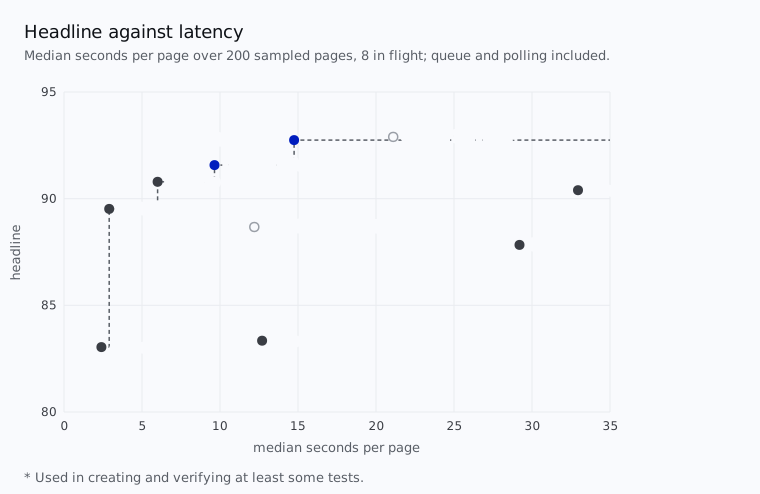
Latency is the time a client waits for one page: upload, queue, processing and polling. We measured it on 200 pages sampled from the benchmark, sending 8 at a time to each parser, with every parser in its own run.
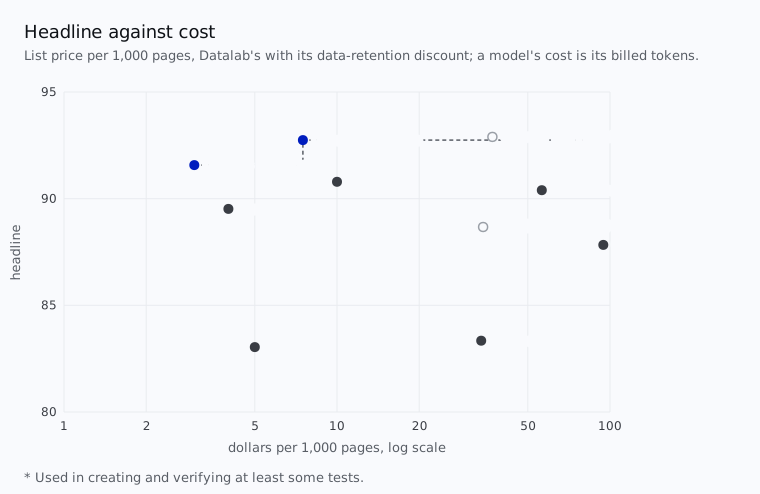
Cost is price per 1,000 pages. For a vendor that bills in credits, it is the credits its responses state times its price per credit. For a general-purpose model we calculate from the tokens it was billed.
Comparing parsers on some tags