
If you’re choosing a document parser, the most useful thing you can do is run a benchmark yourself on the parsers you’re choosing between. Published leaderboards mix runs from different dates, settings and people. Running it yourself leaves one question: does the benchmark’s data, ground truth and scorer give you a fair answer?
We checked that for 15 benchmarks. We ran seven open models through the 13 with public data, had three judge models count the real reading errors in every output, and checked whether each benchmark ranks the models in the same order as their errors. LogicsDocBench and XDocParse keep their test data private, so we score them only on the checks that don’t need a run.
We built OmniParseBench and we sell a parser, so keep that in mind as you read. We publish the scores, the per-benchmark judge results, the error probes and the rubric, so you can check our numbers (see Data).
The short answer
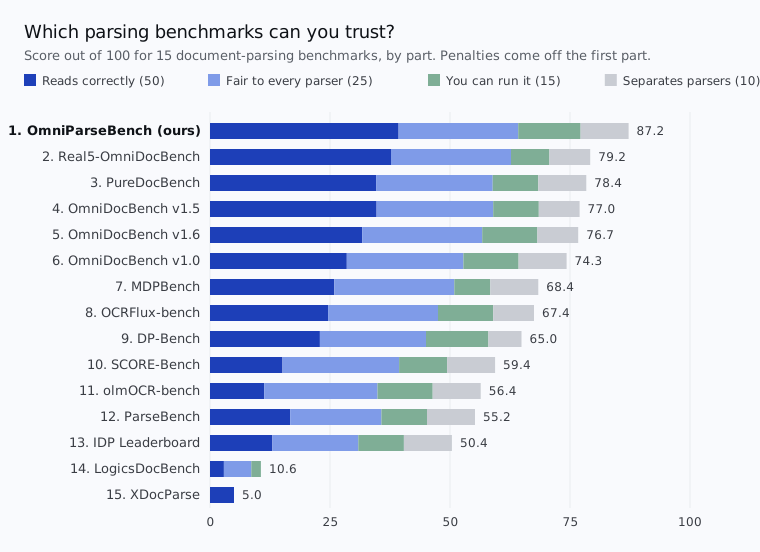
How to read the chart:
- Each benchmark gets up to 100 points in four parts, minus penalties: reads correctly (50), fair to every parser (25), you can run it (15) and separates parsers (10);
- The biggest single item is agreement, worth 25 points: the share of the 21 pairs of our seven models that the benchmark puts in the same order as the judges’ error counts, where 1.00 is every pair and 0.50 is a coin flip;
- About half the benchmarks rank parsers about right: for 7 of the 13 we ran, the low end of agreement’s 90% interval, the range it stays in when we resample the pages, is at least 0.70; and
- Ranks 2 to 6 are within 5 points of each other (74.3 to 79.2), and their agreement intervals overlap OmniParseBench’s, so read the top six as close.
How we tested
Every public benchmark went through the same steps. A benchmark’s headline is the main number it reports. Pick a step to see it.
- olmOCR-2
- MinerU2.5-Pro
- PaddleOCR-VL-1.6
- dots.mocr
- Logics-Parsing-v2
- chandra-ocr-2
- Surya OCR 2
chandra-ocr-2 and Surya OCR 2 are ours. ParseBench has 199 sampled pages, not 200. Each benchmark’s own scorer runs at a pinned commit, in a sandbox with no network. Before scoring, we rewrite every model’s math delimiters to one form, because Surya OCR 2 writes LaTeX inside <math> tags that the OmniDocBench scorers don’t read.
- Gemini 4 Argon
- Claude Opus 5.5
- GPT-5.6 Sol
An error is a wrong, missing or invented word, number, table cell or formula part. Format isn’t an error: a markdown table where the benchmark expects HTML, page headers, heading levels and line breaks don’t count.
the pair is in order
We use the pages all seven models scored, 134 to 200 per benchmark. For each of the 21 pairs, we check whether the benchmark’s mean score and the mean errors per page put the pair in the same order. We resample the pages 1,000 times to get a 90% interval, and score agreement from its low end.
reads correctly 3 checks
- a real error costs more than a format change we add 5 realistic errors (wrong digits, typos, wrong-script words, deleted words, wrong table numbers) at 1, 2, 5 and 10% of the places each can occur, and compare the score drop to harmless format changes
- the ground truth is right the judges check 1,100 to 5,300 ground-truth facts per benchmark (words, numbers, table cells, formulas or test assertions) against the page image, and we count the share that are wrong
- the headline is about reading the share of the headline score that comes from reading text, tables, formulas or layout
fair to every parser 2 checks
- ranks hold under unstated conventions we re-score the 7 models under each convention the benchmark doesn't require (headers kept or removed, tables as HTML or markdown, math delimiters), and measure how far ranks move
- no tests only one format can pass the share of the headline that only one kind of output can pass, like HTML-only tables, charts as tables or required bold and italic
you can run it 1 check
- runs as published two raters check that the test data is public and complete, the scorer runs as published, the output rules are documented and the inference code is included
separates parsers 1 check
- tells close parsers apart we resample pages to find the smallest score gap that is ordered right 80% of the time, and check the best model is below the ceiling
penalties 3 checks
- an empty or shuffled page keeps 80% of the score we score an empty page, the PDF text layer alone and the ground truth with its blocks shuffled
- each bug that flips two parsers we read the scorer code and docs, and re-run any bug we find to see if it changes a ranking
- test pages in a compared model's training data we look for public evidence that the test pages were in a compared model's training data
An error’s cost is how much the benchmark’s own score drops, out of 100, when we add that error to the ground truth, or, on the pass/fail-test benchmarks, to real models’ outputs. For example, with 5% of the digits made wrong, OmniParseBench’s score drops by 4.0.
reads correctly 4 checks 50 points
fair to every parser 2 checks 25 points
you can run it 1 check 15 points
separates parsers 1 check 10 points
penalties 3 checks points off
Limits:
- Seven models give only 21 pairs, so one model can move agreement a lot; and
- The judges are models, not people, though they agree with each other closely.
We fixed the rubric before computing anything, then made nine changes, most after seeing results. Two of them:
- Judging 134 to 200 pages per benchmark instead of 60 moved six benchmarks’ agreement by 0.14 to 0.24, so we use all of those pages and score agreement from the low end of its interval; and
- Surya OCR 2’s formulas first scored near zero, which led to the math delimiter fix in step 1.
The rubric lists every change and why, and how closely the judges agree with each other.
Results per benchmark
In rank order. Each tab gives the benchmark’s rank, score and agreement with the judges, what it is, what we found and what to do if you run it.
- rank
- 1of 15
- score
- 87.2/ 100
- agreement with the judges
- 1.00 21 of 21 pairs in order 90% interval 0.86 to 1.00
- built by
- us
- data
- 16,288 pass/fail tests on 2,937 pages, from 22 suites in 92 languages
How the 87.2 adds up
| check | how it's scored | score |
|---|---|---|
| reads correctly | 44.3/ 50 | |
| ranks parsers like their real errors | 25 × (L − 0.5) / 0.4, kept between 0 and 25, where L is the low end of agreement's 90% interval | 22.3/ 25 |
| a real error costs more than a format change | 5 × the share of error types whose cost rises with the error rate, plus 5 × min(1, R / 5), where R is the median cost of a real error at 5% divided by (the median cost of a format change + 1) | 10.0/ 10 |
| the ground truth is right | 10 if 1% or less of the checked facts are wrong, 7 if 3% or less, 4 if 6% or less, else 0 | 7.0/ 10 |
| the headline is about reading | 5 × the share of the headline that is reading: text, tables, formulas or layout | 4.9/ 5 |
| fair to every parser | 24.9/ 25 | |
| ranks hold under unstated conventions | 15 × (1 − the mean over the 7 models of how far each model's rank moves, out of 6) | 15.0/ 15 |
| no tests only one format can pass | 10 × (1 − the share of the headline that only one kind of output can pass) | 9.9/ 10 |
| you can run it | 13.0/ 15 | |
| runs as published | two raters score: test data public and complete (4), scorer runs as published (4), output rules documented (4) and inference code included (3) | 13.0/ 15 |
| separates parsers | 10.0/ 10 | |
| tells close parsers apart | 7 if the smallest score gap ordered right 80% of the time is 1 or less, down to 0 at 5 or more; plus 3 if the best model is 10 or more below the ceiling, 1.5 if 3 to 10 | 10.0/ 10 |
| penalties | −5.0 | |
| an empty or shuffled page keeps 80% of the score | −5 if an empty page, the PDF text layer alone or the ground truth with its blocks shuffled scores 80% or more of the ground truth's score | −5.0 |
| each bug that flips two parsers | −3 for each scoring bug that flips the order of two real parsers, −1 if fixed, at most −10 | 0.0 |
| test pages in a compared model's training data | −3 for public evidence that test pages were in a compared model's training data | 0.0 |
| total | 87.2/ 100 | |
What we found:
- Real errors cost a lot: at 5% of words, wrong-script words drop the score by 14.0, typos by 9.9 and wrong digits by 4.0;
- Invented text costs nothing;
- The judges found 2.3% of 1,135 checked facts wrong, and 11 of those are in table tests;
- 225 text tests check text in a running header or footer, such as “Page 1 of 5”, so a parser that drops headers and footers fails them, and we don’t document that rule (about 1% of the headline); and
- Our run left out the layout tests, which check the type of each block on the page and are a third of the headline.
If you run it:
- Keep page headers and footers.
- rank
- 2of 15
- score
- 79.2/ 100
- agreement with the judges
- 0.95 20 of 21 pairs in order 90% interval 0.86 to 1.00
- built by
- Baidu's PaddlePaddle team and HKUST (Guangzhou)
- data
- the 1,355 OmniDocBench v1.5 pages, printed and captured again in five conditions (scanning, warping, screen photography, lighting and skew), for 6,775 images
- scorer
- the v1.5 scorer, unchanged, so every problem in the OmniDocBench v1.5 tab applies
How the 79.2 adds up
| check | how it's scored | score |
|---|---|---|
| reads correctly | 42.7/ 50 | |
| ranks parsers like their real errors | 25 × (L − 0.5) / 0.4, kept between 0 and 25, where L is the low end of agreement's 90% interval | 22.3/ 25 |
| a real error costs more than a format change | 5 × the share of error types whose cost rises with the error rate, plus 5 × min(1, R / 5), where R is the median cost of a real error at 5% divided by (the median cost of a format change + 1) | 5.3/ 10 |
| the ground truth is right | 10 if 1% or less of the checked facts are wrong, 7 if 3% or less, 4 if 6% or less, else 0 | 10.0/ 10 |
| the headline is about reading | 5 × the share of the headline that is reading: text, tables, formulas or layout | 5.0/ 5 |
| fair to every parser | 25.0/ 25 | |
| ranks hold under unstated conventions | 15 × (1 − the mean over the 7 models of how far each model's rank moves, out of 6) | 15.0/ 15 |
| no tests only one format can pass | 10 × (1 − the share of the headline that only one kind of output can pass) | 10.0/ 10 |
| you can run it | 8.0/ 15 | |
| runs as published | two raters score: test data public and complete (4), scorer runs as published (4), output rules documented (4) and inference code included (3) | 8.0/ 15 |
| separates parsers | 8.5/ 10 | |
| tells close parsers apart | 7 if the smallest score gap ordered right 80% of the time is 1 or less, down to 0 at 5 or more; plus 3 if the best model is 10 or more below the ceiling, 1.5 if 3 to 10 | 8.5/ 10 |
| penalties | −5.0 | |
| an empty or shuffled page keeps 80% of the score | −5 if an empty page, the PDF text layer alone or the ground truth with its blocks shuffled scores 80% or more of the ground truth's score | −5.0 |
| each bug that flips two parsers | −3 for each scoring bug that flips the order of two real parsers, −1 if fixed, at most −10 | 0.0 |
| test pages in a compared model's training data | −3 for public evidence that test pages were in a compared model's training data | 0.0 |
| total | 79.2/ 100 | |
What we found:
- The five conditions match distortions in PaddleOCR-VL-1.5’s training data: its formula data “incorporates CV-simulated artifacts” to replicate “scanning, warping, screen-capture, and geometric skewing” (paper); and
- The judges found 0.27% of 4,239 checked facts wrong.
If you run it:
- First do the checks in the OmniDocBench v1.5 tab; and
- Compare one parser’s v1.5 and Real5 scores to see how much it loses on real captures.
- rank
- 3of 15
- score
- 78.4/ 100
- agreement with the judges
- 0.90 19 of 21 pairs in order 90% interval 0.81 to 0.90
- built by
- the University of Chinese Academy of Sciences, CASIA and others
- data
- 1,475 pages, each as a clean, a degraded and a real capture
- ground truth
- LLMs wrote each page as HTML, a browser rendered it, and the ground truth is the same HTML, with a human review of every page
How the 78.4 adds up
| check | how it's scored | score |
|---|---|---|
| reads correctly | 39.6/ 50 | |
| ranks parsers like their real errors | 25 × (L − 0.5) / 0.4, kept between 0 and 25, where L is the low end of agreement's 90% interval | 19.3/ 25 |
| a real error costs more than a format change | 5 × the share of error types whose cost rises with the error rate, plus 5 × min(1, R / 5), where R is the median cost of a real error at 5% divided by (the median cost of a format change + 1) | 5.2/ 10 |
| the ground truth is right | 10 if 1% or less of the checked facts are wrong, 7 if 3% or less, 4 if 6% or less, else 0 | 10.0/ 10 |
| the headline is about reading | 5 × the share of the headline that is reading: text, tables, formulas or layout | 5.0/ 5 |
| fair to every parser | 24.3/ 25 | |
| ranks hold under unstated conventions | 15 × (1 − the mean over the 7 models of how far each model's rank moves, out of 6) | 14.3/ 15 |
| no tests only one format can pass | 10 × (1 − the share of the headline that only one kind of output can pass) | 10.0/ 10 |
| you can run it | 9.5/ 15 | |
| runs as published | two raters score: test data public and complete (4), scorer runs as published (4), output rules documented (4) and inference code included (3) | 9.5/ 15 |
| separates parsers | 10.0/ 10 | |
| tells close parsers apart | 7 if the smallest score gap ordered right 80% of the time is 1 or less, down to 0 at 5 or more; plus 3 if the best model is 10 or more below the ceiling, 1.5 if 3 to 10 | 10.0/ 10 |
| penalties | −5.0 | |
| an empty or shuffled page keeps 80% of the score | −5 if an empty page, the PDF text layer alone or the ground truth with its blocks shuffled scores 80% or more of the ground truth's score | −5.0 |
| each bug that flips two parsers | −3 for each scoring bug that flips the order of two real parsers, −1 if fixed, at most −10 | 0.0 |
| test pages in a compared model's training data | −3 for public evidence that test pages were in a compared model's training data | 0.0 |
| total | 78.4/ 100 | |
What we found:
- The judges found 0.10% of 5,267 checked facts wrong;
- The ground truth scores 96.99 against itself, not 100, because it leaves the reading order empty on 1,119 of 1,475 pages;
- The repo doesn’t pin the evaluator, and a user reports that their reproduction “differs greatly” (#5);
- We found no evaluated model tied to the authors; and
- We ran only the clean track.
If you run it:
- Pin the evaluator and the ground-truth revision; and
- Write math with
$.
- rank
- 4of 15
- score
- 77.0/ 100
- agreement with the judges
- 0.86 18 of 21 pairs in order 90% interval 0.81 to 0.90
- data
- OmniDocBench v1.0 plus 374 pages, for 1,355
- text scorer
- edit distance: the number of characters you'd change to turn the output into the ground truth
- table scorer
- TEDS: compares the tree structure of two HTML tables
- formula scorer
- CDM: renders each formula and matches its characters to the ground truth's
How the 77.0 adds up
| check | how it's scored | score |
|---|---|---|
| reads correctly | 39.7/ 50 | |
| ranks parsers like their real errors | 25 × (L − 0.5) / 0.4, kept between 0 and 25, where L is the low end of agreement's 90% interval | 19.3/ 25 |
| a real error costs more than a format change | 5 × the share of error types whose cost rises with the error rate, plus 5 × min(1, R / 5), where R is the median cost of a real error at 5% divided by (the median cost of a format change + 1) | 5.3/ 10 |
| the ground truth is right | 10 if 1% or less of the checked facts are wrong, 7 if 3% or less, 4 if 6% or less, else 0 | 10.0/ 10 |
| the headline is about reading | 5 × the share of the headline that is reading: text, tables, formulas or layout | 5.0/ 5 |
| fair to every parser | 24.3/ 25 | |
| ranks hold under unstated conventions | 15 × (1 − the mean over the 7 models of how far each model's rank moves, out of 6) | 14.3/ 15 |
| no tests only one format can pass | 10 × (1 − the share of the headline that only one kind of output can pass) | 10.0/ 10 |
| you can run it | 9.5/ 15 | |
| runs as published | two raters score: test data public and complete (4), scorer runs as published (4), output rules documented (4) and inference code included (3) | 9.5/ 15 |
| separates parsers | 8.5/ 10 | |
| tells close parsers apart | 7 if the smallest score gap ordered right 80% of the time is 1 or less, down to 0 at 5 or more; plus 3 if the best model is 10 or more below the ceiling, 1.5 if 3 to 10 | 8.5/ 10 |
| penalties | −5.0 | |
| an empty or shuffled page keeps 80% of the score | −5 if an empty page, the PDF text layer alone or the ground truth with its blocks shuffled scores 80% or more of the ground truth's score | −5.0 |
| each bug that flips two parsers | −3 for each scoring bug that flips the order of two real parsers, −1 if fixed, at most −10 | 0.0 |
| test pages in a compared model's training data | −3 for public evidence that test pages were in a compared model's training data | 0.0 |
| total | 77.0/ 100 | |
What we found:
- Invented text is almost free: half a page of junk raises text edit distance by only 0.12 out of 100;
- The requirements leave out scikit-image, and without it every formula scores 0 and nothing reports an error;
- Pretty-printed table HTML drops the TEDS score by 22, more than a dropped row does; and
- A missing page is skipped, and nothing counts it.
If you run it:
- Check that the formula score is above 0;
- Write compact table HTML; and
- Write an output file for every page.
- rank
- 5of 15
- score
- 76.7/ 100
- agreement with the judges
- 0.81 17 of 21 pairs in order 90% interval 0.76 to 0.90
- data
- the v1.5 pages with corrections, plus 296 Hard pages, for 1,651
- Hard pages
- pages where MinerU2.5, PaddleOCR-VL and Qwen3-VL disagree
How the 76.7 adds up
| check | how it's scored | score |
|---|---|---|
| reads correctly | 36.7/ 50 | |
| ranks parsers like their real errors | 25 × (L − 0.5) / 0.4, kept between 0 and 25, where L is the low end of agreement's 90% interval | 16.4/ 25 |
| a real error costs more than a format change | 5 × the share of error types whose cost rises with the error rate, plus 5 × min(1, R / 5), where R is the median cost of a real error at 5% divided by (the median cost of a format change + 1) | 5.3/ 10 |
| the ground truth is right | 10 if 1% or less of the checked facts are wrong, 7 if 3% or less, 4 if 6% or less, else 0 | 10.0/ 10 |
| the headline is about reading | 5 × the share of the headline that is reading: text, tables, formulas or layout | 5.0/ 5 |
| fair to every parser | 25.0/ 25 | |
| ranks hold under unstated conventions | 15 × (1 − the mean over the 7 models of how far each model's rank moves, out of 6) | 15.0/ 15 |
| no tests only one format can pass | 10 × (1 − the share of the headline that only one kind of output can pass) | 10.0/ 10 |
| you can run it | 11.5/ 15 | |
| runs as published | two raters score: test data public and complete (4), scorer runs as published (4), output rules documented (4) and inference code included (3) | 11.5/ 15 |
| separates parsers | 8.5/ 10 | |
| tells close parsers apart | 7 if the smallest score gap ordered right 80% of the time is 1 or less, down to 0 at 5 or more; plus 3 if the best model is 10 or more below the ceiling, 1.5 if 3 to 10 | 8.5/ 10 |
| penalties | −5.0 | |
| an empty or shuffled page keeps 80% of the score | −5 if an empty page, the PDF text layer alone or the ground truth with its blocks shuffled scores 80% or more of the ground truth's score | −5.0 |
| each bug that flips two parsers | −3 for each scoring bug that flips the order of two real parsers, −1 if fixed, at most −10 | 0.0 |
| test pages in a compared model's training data | −3 for public evidence that test pages were in a compared model's training data | 0.0 |
| total | 76.7/ 100 | |
What we found:
- It fixes two v1.5 problems: a missing page now scores as empty, and pretty-printed HTML costs nothing;
- Invented text is still almost free;
- The judges found 0.22% of 4,464 checked facts wrong; and
- The leaderboard shows 96.34 for PaddleOCR-VL-1.6, but the maintainers’ posted re-run gave 94.82 (#246).
If you run it:
- Use this version of OmniDocBench for new comparisons; and
- Run both parsers yourself before you trust a score gap under 2.
- rank
- 6of 15
- score
- 74.3/ 100
- agreement with the judges
- 0.86 18 of 21 pairs in order 90% interval 0.71 to 0.90
- built by
- Shanghai AI Laboratory, which also builds MinerU
- released
- at CVPR 2025
- data
- 981 pages in English and Chinese
- scorer
- edit distance
How the 74.3 adds up
| check | how it's scored | score |
|---|---|---|
| reads correctly | 33.5/ 50 | |
| ranks parsers like their real errors | 25 × (L − 0.5) / 0.4, kept between 0 and 25, where L is the low end of agreement's 90% interval | 13.4/ 25 |
| a real error costs more than a format change | 5 × the share of error types whose cost rises with the error rate, plus 5 × min(1, R / 5), where R is the median cost of a real error at 5% divided by (the median cost of a format change + 1) | 5.1/ 10 |
| the ground truth is right | 10 if 1% or less of the checked facts are wrong, 7 if 3% or less, 4 if 6% or less, else 0 | 10.0/ 10 |
| the headline is about reading | 5 × the share of the headline that is reading: text, tables, formulas or layout | 5.0/ 5 |
| fair to every parser | 24.3/ 25 | |
| ranks hold under unstated conventions | 15 × (1 − the mean over the 7 models of how far each model's rank moves, out of 6) | 14.3/ 15 |
| no tests only one format can pass | 10 × (1 − the share of the headline that only one kind of output can pass) | 10.0/ 10 |
| you can run it | 11.5/ 15 | |
| runs as published | two raters score: test data public and complete (4), scorer runs as published (4), output rules documented (4) and inference code included (3) | 11.5/ 15 |
| separates parsers | 10.0/ 10 | |
| tells close parsers apart | 7 if the smallest score gap ordered right 80% of the time is 1 or less, down to 0 at 5 or more; plus 3 if the best model is 10 or more below the ceiling, 1.5 if 3 to 10 | 10.0/ 10 |
| penalties | −5.0 | |
| an empty or shuffled page keeps 80% of the score | −5 if an empty page, the PDF text layer alone or the ground truth with its blocks shuffled scores 80% or more of the ground truth's score | −5.0 |
| each bug that flips two parsers | −3 for each scoring bug that flips the order of two real parsers, −1 if fixed, at most −10 | 0.0 |
| test pages in a compared model's training data | −3 for public evidence that test pages were in a compared model's training data | 0.0 |
| total | 74.3/ 100 | |
What we found:
- It’s the only OmniDocBench version that charges for invented text: half a page of junk raises text edit distance by 4.6 out of 100;
- A perfect formula scores an edit distance of 0.129, not 0, because the ground truth keeps
$$in its formula field and the scorer strips it only from the model’s output; and - A missing page is skipped with a warning, and nothing counts it.
If you run it:
- Use it to compare with papers from before September 2025; and
- Subtract the 0.129 formula floor.
- rank
- 7of 15
- score
- 68.4/ 100
- agreement with the judges
- 0.90 19 of 21 pairs in order 90% interval 0.71 to 0.90
- built by
- Huazhong University of Science and Technology and Kingsoft Office
- data
- 850 documents in 17 languages, each also photographed three times: 2,720 images are public and 680 are private
- scorer
- a fork of the OmniDocBench v1.5 scorer
How the 68.4 adds up
| check | how it's scored | score |
|---|---|---|
| reads correctly | 30.9/ 50 | |
| ranks parsers like their real errors | 25 × (L − 0.5) / 0.4, kept between 0 and 25, where L is the low end of agreement's 90% interval | 13.4/ 25 |
| a real error costs more than a format change | 5 × the share of error types whose cost rises with the error rate, plus 5 × min(1, R / 5), where R is the median cost of a real error at 5% divided by (the median cost of a format change + 1) | 5.5/ 10 |
| the ground truth is right | 10 if 1% or less of the checked facts are wrong, 7 if 3% or less, 4 if 6% or less, else 0 | 7.0/ 10 |
| the headline is about reading | 5 × the share of the headline that is reading: text, tables, formulas or layout | 5.0/ 5 |
| fair to every parser | 25.0/ 25 | |
| ranks hold under unstated conventions | 15 × (1 − the mean over the 7 models of how far each model's rank moves, out of 6) | 15.0/ 15 |
| no tests only one format can pass | 10 × (1 − the share of the headline that only one kind of output can pass) | 10.0/ 10 |
| you can run it | 7.5/ 15 | |
| runs as published | two raters score: test data public and complete (4), scorer runs as published (4), output rules documented (4) and inference code included (3) | 7.5/ 15 |
| separates parsers | 10.0/ 10 | |
| tells close parsers apart | 7 if the smallest score gap ordered right 80% of the time is 1 or less, down to 0 at 5 or more; plus 3 if the best model is 10 or more below the ceiling, 1.5 if 3 to 10 | 10.0/ 10 |
| penalties | −5.0 | |
| an empty or shuffled page keeps 80% of the score | −5 if an empty page, the PDF text layer alone or the ground truth with its blocks shuffled scores 80% or more of the ground truth's score | −5.0 |
| each bug that flips two parsers | −3 for each scoring bug that flips the order of two real parsers, −1 if fixed, at most −10 | 0.0 |
| test pages in a compared model's training data | −3 for public evidence that test pages were in a compared model's training data | 0.0 |
| total | 68.4/ 100 | |
What we found:
- The scorer turns
x.JPEGintox..md, so pages with a.JPEGfile name silently don’t count: in our first run 95 of 200 pages dropped out, and the ground truth still scored 99.7; - A missing page is skipped with one warning line and no count, and the official scripts write no file when a model call fails; and
- The judges found 1.7% of 4,674 checked facts wrong, but 68.5 of those 81 (counts are averaged across judges) are on one disputed page, and without it the rate is 0.28%.
If you run it:
- Rename
.JPEGfiles; - Write an empty file for every failed page; and
- Count the pages that scored.
- rank
- 8of 15
- score
- 67.4/ 100
- agreement with the judges
- 0.67 14 of 21 pairs in order 90% interval 0.57 to 0.81
- built by
- ChatDOC, which ships OCRFlux-3B
- data
- 2,000 English and Chinese pages
- scorer
- edit distance on the raw markdown
How the 67.4 adds up
| check | how it's scored | score |
|---|---|---|
| reads correctly | 24.6/ 50 | |
| ranks parsers like their real errors | 25 × (L − 0.5) / 0.4, kept between 0 and 25, where L is the low end of agreement's 90% interval | 4.5/ 25 |
| a real error costs more than a format change | 5 × the share of error types whose cost rises with the error rate, plus 5 × min(1, R / 5), where R is the median cost of a real error at 5% divided by (the median cost of a format change + 1) | 5.1/ 10 |
| the ground truth is right | 10 if 1% or less of the checked facts are wrong, 7 if 3% or less, 4 if 6% or less, else 0 | 10.0/ 10 |
| the headline is about reading | 5 × the share of the headline that is reading: text, tables, formulas or layout | 5.0/ 5 |
| fair to every parser | 22.9/ 25 | |
| ranks hold under unstated conventions | 15 × (1 − the mean over the 7 models of how far each model's rank moves, out of 6) | 12.9/ 15 |
| no tests only one format can pass | 10 × (1 − the share of the headline that only one kind of output can pass) | 10.0/ 10 |
| you can run it | 11.5/ 15 | |
| runs as published | two raters score: test data public and complete (4), scorer runs as published (4), output rules documented (4) and inference code included (3) | 11.5/ 15 |
| separates parsers | 8.5/ 10 | |
| tells close parsers apart | 7 if the smallest score gap ordered right 80% of the time is 1 or less, down to 0 at 5 or more; plus 3 if the best model is 10 or more below the ceiling, 1.5 if 3 to 10 | 8.5/ 10 |
| penalties | 0.0 | |
| an empty or shuffled page keeps 80% of the score | −5 if an empty page, the PDF text layer alone or the ground truth with its blocks shuffled scores 80% or more of the ground truth's score | 0.0 |
| each bug that flips two parsers | −3 for each scoring bug that flips the order of two real parsers, −1 if fixed, at most −10 | 0.0 |
| test pages in a compared model's training data | −3 for public evidence that test pages were in a compared model's training data | 0.0 |
| total | 67.4/ 100 | |
What we found:
- Format costs more than reading: a harmless format change moves the score by 1.28 at the median, and realistic errors at a 5% rate move it by 0.28;
- The ground truth uses one format: every heading is H1, and tables are plain
<tr>and<td>; and - PaddleOCR-VL-1.6 scores 86.1 after we convert its output to the ground-truth format, and 61.2 without the conversion.
If you run it:
- Convert every parser’s headings and tables to the ground-truth format first.
- rank
- 9of 15
- score
- 65.0/ 100
- agreement with the judges
- 0.81 17 of 21 pairs in order 90% interval 0.62 to 0.90
- built by
- Upstage, which sells Document Parse
- data
- 200 pages
- text scorer
- NID: an edit distance over the text in reading order
- table scorer
- TEDS
How the 65.0 adds up
| check | how it's scored | score |
|---|---|---|
| reads correctly | 27.9/ 50 | |
| ranks parsers like their real errors | 25 × (L − 0.5) / 0.4, kept between 0 and 25, where L is the low end of agreement's 90% interval | 7.4/ 25 |
| a real error costs more than a format change | 5 × the share of error types whose cost rises with the error rate, plus 5 × min(1, R / 5), where R is the median cost of a real error at 5% divided by (the median cost of a format change + 1) | 5.5/ 10 |
| the ground truth is right | 10 if 1% or less of the checked facts are wrong, 7 if 3% or less, 4 if 6% or less, else 0 | 10.0/ 10 |
| the headline is about reading | 5 × the share of the headline that is reading: text, tables, formulas or layout | 5.0/ 5 |
| fair to every parser | 22.1/ 25 | |
| ranks hold under unstated conventions | 15 × (1 − the mean over the 7 models of how far each model's rank moves, out of 6) | 12.1/ 15 |
| no tests only one format can pass | 10 × (1 − the share of the headline that only one kind of output can pass) | 10.0/ 10 |
| you can run it | 13.0/ 15 | |
| runs as published | two raters score: test data public and complete (4), scorer runs as published (4), output rules documented (4) and inference code included (3) | 13.0/ 15 |
| separates parsers | 6.9/ 10 | |
| tells close parsers apart | 7 if the smallest score gap ordered right 80% of the time is 1 or less, down to 0 at 5 or more; plus 3 if the best model is 10 or more below the ceiling, 1.5 if 3 to 10 | 6.9/ 10 |
| penalties | −5.0 | |
| an empty or shuffled page keeps 80% of the score | −5 if an empty page, the PDF text layer alone or the ground truth with its blocks shuffled scores 80% or more of the ground truth's score | −5.0 |
| each bug that flips two parsers | −3 for each scoring bug that flips the order of two real parsers, −1 if fixed, at most −10 | 0.0 |
| test pages in a compared model's training data | −3 for public evidence that test pages were in a compared model's training data | 0.0 |
| total | 65.0/ 100 | |
What we found:
- NID skips text that a parser labels as a chart or figure, in Upstage’s 12 label classes;
- Upstage’s enhanced mode puts 24.5% of its text under those labels, and with that text labeled as paragraphs its score would drop from 96.62 to 82.33;
- TEDS averages only the tables a parser found, so a missed table costs nothing;
- Pretty-printed table HTML drops the TEDS score by 38; and
- The best open model scores 97.0, so there’s little room left at the top.
If you run it:
- Map every parser’s labels to the 12 classes the same way;
- Write compact table HTML; and
- Read the missing-page count it prints.
- rank
- 10of 15
- score
- 59.4/ 100
- agreement with the judges
- 0.62 13 of 21 pairs in order 90% interval 0.52 to 0.81
- built by
- Unstructured, which sells parsing pipelines
- data
- 224 business documents with scans, handwriting and forms
- scorer
- CCT: a text-fidelity score from Unstructured's SCORE paper
How the 59.4 adds up
| check | how it's scored | score |
|---|---|---|
| reads correctly | 20.1/ 50 | |
| ranks parsers like their real errors | 25 × (L − 0.5) / 0.4, kept between 0 and 25, where L is the low end of agreement's 90% interval | 1.5/ 25 |
| a real error costs more than a format change | 5 × the share of error types whose cost rises with the error rate, plus 5 × min(1, R / 5), where R is the median cost of a real error at 5% divided by (the median cost of a format change + 1) | 5.3/ 10 |
| the ground truth is right | 10 if 1% or less of the checked facts are wrong, 7 if 3% or less, 4 if 6% or less, else 0 | 10.0/ 10 |
| the headline is about reading | 5 × the share of the headline that is reading: text, tables, formulas or layout | 3.3/ 5 |
| fair to every parser | 24.3/ 25 | |
| ranks hold under unstated conventions | 15 × (1 − the mean over the 7 models of how far each model's rank moves, out of 6) | 14.3/ 15 |
| no tests only one format can pass | 10 × (1 − the share of the headline that only one kind of output can pass) | 10.0/ 10 |
| you can run it | 10.0/ 15 | |
| runs as published | two raters score: test data public and complete (4), scorer runs as published (4), output rules documented (4) and inference code included (3) | 10.0/ 15 |
| separates parsers | 10.0/ 10 | |
| tells close parsers apart | 7 if the smallest score gap ordered right 80% of the time is 1 or less, down to 0 at 5 or more; plus 3 if the best model is 10 or more below the ceiling, 1.5 if 3 to 10 | 10.0/ 10 |
| penalties | −5.0 | |
| an empty or shuffled page keeps 80% of the score | −5 if an empty page, the PDF text layer alone or the ground truth with its blocks shuffled scores 80% or more of the ground truth's score | −5.0 |
| each bug that flips two parsers | −3 for each scoring bug that flips the order of two real parsers, −1 if fixed, at most −10 | 0.0 |
| test pages in a compared model's training data | −3 for public evidence that test pages were in a compared model's training data | 0.0 |
| total | 59.4/ 100 | |
What we found:
- 2% typos and 1% wrong digits move CCT by less than 0.05 out of 100, below the three decimals it reports; and
- A missing file becomes “not a number” and drops out of the mean, and nothing counts it.
If you run it:
- Check that every parser returned all 224 documents.
- rank
- 11of 15
- score
- 56.4/ 100
- agreement with the judges
- 0.57 12 of 21 pairs in order 90% interval 0.48 to 0.71
- built by
- the Allen Institute for AI
- data
- 1,403 PDF pages and 7,010 pass/fail tests
- our run
- scored under its own rule that page headers be left out
How the 56.4 adds up
| check | how it's scored | score |
|---|---|---|
| reads correctly | 17.3/ 50 | |
| ranks parsers like their real errors | 25 × (L − 0.5) / 0.4, kept between 0 and 25, where L is the low end of agreement's 90% interval | 0.0/ 25 |
| a real error costs more than a format change | 5 × the share of error types whose cost rises with the error rate, plus 5 × min(1, R / 5), where R is the median cost of a real error at 5% divided by (the median cost of a format change + 1) | 9.0/ 10 |
| the ground truth is right | 10 if 1% or less of the checked facts are wrong, 7 if 3% or less, 4 if 6% or less, else 0 | 4.0/ 10 |
| the headline is about reading | 5 × the share of the headline that is reading: text, tables, formulas or layout | 4.3/ 5 |
| fair to every parser | 23.6/ 25 | |
| ranks hold under unstated conventions | 15 × (1 − the mean over the 7 models of how far each model's rank moves, out of 6) | 15.0/ 15 |
| no tests only one format can pass | 10 × (1 − the share of the headline that only one kind of output can pass) | 8.6/ 10 |
| you can run it | 11.5/ 15 | |
| runs as published | two raters score: test data public and complete (4), scorer runs as published (4), output rules documented (4) and inference code included (3) | 11.5/ 15 |
| separates parsers | 10.0/ 10 | |
| tells close parsers apart | 7 if the smallest score gap ordered right 80% of the time is 1 or less, down to 0 at 5 or more; plus 3 if the best model is 10 or more below the ceiling, 1.5 if 3 to 10 | 10.0/ 10 |
| penalties | −6.0 | |
| an empty or shuffled page keeps 80% of the score | −5 if an empty page, the PDF text layer alone or the ground truth with its blocks shuffled scores 80% or more of the ground truth's score | −5.0 |
| each bug that flips two parsers | −3 for each scoring bug that flips the order of two real parsers, −1 if fixed, at most −10 | −1.0 |
| test pages in a compared model's training data | −3 for public evidence that test pages were in a compared model's training data | 0.0 |
| total | 56.4/ 100 | |
What we found:
- The tests are sparse: each test checks a few facts, and text that no test covers is free;
- olmOCR-2 scores 100% on 119 of 200 pages, and the judges find errors on 68 of those, such as “Ultraslabile” for “Ultrastable” and “Bozkulu” for “Bozoklu” on one page;
- Under its header rule, it ranks olmOCR-2 and PaddleOCR-VL-1.6 second and third, but the judges count more errors for them (7.1 and 8.1 per page) than for any model except Logics-Parsing-v2, and six of the nine pairs it orders wrong involve one of the two;
- When a test does catch an error, it charges a lot: at 5% of words, deleted words drop the score by 26.4, wrong-script words by 13.5 and typos by 7.4;
- There is room at the top: the best of our seven models, chandra-ocr-2, scores 84 out of 100 under its header rule;
- The judges found 3.8% of 1,100 checked facts wrong, the most of the 13: misread old scans, case errors and math tests whose formula is on another page;
- 14% of the headline needs one output convention, mostly page headers left out; and
- The package doesn’t declare all the libraries its tests import, and one missing library fails every test of that type.
If you run it:
- Leave out page headers for every parser;
- Install every library the tests import; and
- Read it as a check on specific facts, not on whole pages.
- rank
- 12of 15
- score
- 55.2/ 100
- agreement with the judges
- 0.62 13 of 21 pairs in order 90% interval 0.57 to 0.76
- built by
- LlamaIndex, which sells LlamaParse
- data
- 2,078 pages and 169,011 rules in five dimensions
How the 55.2 adds up
| check | how it's scored | score |
|---|---|---|
| reads correctly | 21.7/ 50 | |
| ranks parsers like their real errors | 25 × (L − 0.5) / 0.4, kept between 0 and 25, where L is the low end of agreement's 90% interval | 4.5/ 25 |
| a real error costs more than a format change | 5 × the share of error types whose cost rises with the error rate, plus 5 × min(1, R / 5), where R is the median cost of a real error at 5% divided by (the median cost of a format change + 1) | 7.2/ 10 |
| the ground truth is right | 10 if 1% or less of the checked facts are wrong, 7 if 3% or less, 4 if 6% or less, else 0 | 7.0/ 10 |
| the headline is about reading | 5 × the share of the headline that is reading: text, tables, formulas or layout | 3.0/ 5 |
| fair to every parser | 19.0/ 25 | |
| ranks hold under unstated conventions | 15 × (1 − the mean over the 7 models of how far each model's rank moves, out of 6) | 15.0/ 15 |
| no tests only one format can pass | 10 × (1 − the share of the headline that only one kind of output can pass) | 4.0/ 10 |
| you can run it | 9.5/ 15 | |
| runs as published | two raters score: test data public and complete (4), scorer runs as published (4), output rules documented (4) and inference code included (3) | 9.5/ 15 |
| separates parsers | 10.0/ 10 | |
| tells close parsers apart | 7 if the smallest score gap ordered right 80% of the time is 1 or less, down to 0 at 5 or more; plus 3 if the best model is 10 or more below the ceiling, 1.5 if 3 to 10 | 10.0/ 10 |
| penalties | −5.0 | |
| an empty or shuffled page keeps 80% of the score | −5 if an empty page, the PDF text layer alone or the ground truth with its blocks shuffled scores 80% or more of the ground truth's score | −5.0 |
| each bug that flips two parsers | −3 for each scoring bug that flips the order of two real parsers, −1 if fixed, at most −10 | 0.0 |
| test pages in a compared model's training data | −3 for public evidence that test pages were in a compared model's training data | 0.0 |
| total | 55.2/ 100 | |
What we found:
- The judges found 1.3% of 3,038 checked facts wrong; and
- 60% of the headline needs one output format:
- Tables reads only HTML: ParseBench’s own harness converts pipe tables to HTML, but a pipe table that skips that converter drops the Tables score by 44 to 57, and the docs don’t say so;
- Charts needs charts converted to tables: chandra-ocr-2 scores 72.0, and five models 2.3 to 3.6; and
- Semantic Formatting needs bold and italic markup.
If you run it:
- Use Tables and Content Faithfulness, with HTML tables; and
- Read Charts and Semantic Formatting as feature checks.
- rank
- 13of 15
- score
- 50.4/ 100
- agreement with the judges
- 0.67 14 of 21 pairs in order 90% interval 0.43 to 0.76
- run by
- Nanonets, which sells Nanonets OCR
- overall score
- the mean of olmOCR-bench, OmniDocBench v1.5 and Nanonets' own IDP Core
- our run
- the table part of IDP Core
How the 50.4 adds up
| check | how it's scored | score |
|---|---|---|
| reads correctly | 18.0/ 50 | |
| ranks parsers like their real errors | 25 × (L − 0.5) / 0.4, kept between 0 and 25, where L is the low end of agreement's 90% interval | 0.0/ 25 |
| a real error costs more than a format change | 5 × the share of error types whose cost rises with the error rate, plus 5 × min(1, R / 5), where R is the median cost of a real error at 5% divided by (the median cost of a format change + 1) | 4.1/ 10 |
| the ground truth is right | 10 if 1% or less of the checked facts are wrong, 7 if 3% or less, 4 if 6% or less, else 0 | 10.0/ 10 |
| the headline is about reading | 5 × the share of the headline that is reading: text, tables, formulas or layout | 4.0/ 5 |
| fair to every parser | 17.9/ 25 | |
| ranks hold under unstated conventions | 15 × (1 − the mean over the 7 models of how far each model's rank moves, out of 6) | 9.3/ 15 |
| no tests only one format can pass | 10 × (1 − the share of the headline that only one kind of output can pass) | 8.6/ 10 |
| you can run it | 9.5/ 15 | |
| runs as published | two raters score: test data public and complete (4), scorer runs as published (4), output rules documented (4) and inference code included (3) | 9.5/ 15 |
| separates parsers | 10.0/ 10 | |
| tells close parsers apart | 7 if the smallest score gap ordered right 80% of the time is 1 or less, down to 0 at 5 or more; plus 3 if the best model is 10 or more below the ceiling, 1.5 if 3 to 10 | 10.0/ 10 |
| penalties | −5.0 | |
| an empty or shuffled page keeps 80% of the score | −5 if an empty page, the PDF text layer alone or the ground truth with its blocks shuffled scores 80% or more of the ground truth's score | −5.0 |
| each bug that flips two parsers | −3 for each scoring bug that flips the order of two real parsers, −1 if fixed, at most −10 | 0.0 |
| test pages in a compared model's training data | −3 for public evidence that test pages were in a compared model's training data | 0.0 |
| total | 50.4/ 100 | |
What we found:
- Format costs more than content: a code fence around a correct transcription drops it from 100 to 33.5, and a trailing period drops a ChartQA answer from 100 to 72.9;
- Nanonets’ own model gets a schema endpoint for key extraction, while other models get a prompt and a regex;
- The harness keeps each model’s best run; and
- Two handwriting sets use a public training split as the test set.
If you run it:
- Don’t use the overall score;
- Score each part separately; and
- Strip code fences and trailing punctuation.
- rank
- 14, 15of 15
- score
- 10.6, 5.0/ 100
- agreement with the judges
- not run: the test data is private
- LogicsDocBench
- built by Alibaba's Logics team, 900 pages
- XDocParse
- built by Xiaohongshu's hi lab, 126 languages
How LogicsDocBench's 10.6 adds up
| check | how it's scored | score |
|---|---|---|
| reads correctly | 2.9/ 50 | |
| ranks parsers like their real errors | 25 × (L − 0.5) / 0.4, kept between 0 and 25, where L is the low end of agreement's 90% interval | 0.0/ 25 |
| a real error costs more than a format change | 5 × the share of error types whose cost rises with the error rate, plus 5 × min(1, R / 5), where R is the median cost of a real error at 5% divided by (the median cost of a format change + 1) | 0.0/ 10 |
| the ground truth is right | 10 if 1% or less of the checked facts are wrong, 7 if 3% or less, 4 if 6% or less, else 0 | 0.0/ 10 |
| the headline is about reading | 5 × the share of the headline that is reading: text, tables, formulas or layout | 2.9/ 5 |
| fair to every parser | 5.7/ 25 | |
| ranks hold under unstated conventions | 15 × (1 − the mean over the 7 models of how far each model's rank moves, out of 6) | 0.0/ 15 |
| no tests only one format can pass | 10 × (1 − the share of the headline that only one kind of output can pass) | 5.7/ 10 |
| you can run it | 2.0/ 15 | |
| runs as published | two raters score: test data public and complete (4), scorer runs as published (4), output rules documented (4) and inference code included (3) | 2.0/ 15 |
| separates parsers | 0.0/ 10 | |
| tells close parsers apart | 7 if the smallest score gap ordered right 80% of the time is 1 or less, down to 0 at 5 or more; plus 3 if the best model is 10 or more below the ceiling, 1.5 if 3 to 10 | 0.0/ 10 |
| penalties | 0.0 | |
| an empty or shuffled page keeps 80% of the score | −5 if an empty page, the PDF text layer alone or the ground truth with its blocks shuffled scores 80% or more of the ground truth's score | 0.0 |
| each bug that flips two parsers | −3 for each scoring bug that flips the order of two real parsers, −1 if fixed, at most −10 | 0.0 |
| test pages in a compared model's training data | −3 for public evidence that test pages were in a compared model's training data | 0.0 |
| total | 10.6/ 100 | |
How XDocParse's 5.0 adds up
| check | how it's scored | score |
|---|---|---|
| reads correctly | 5.0/ 50 | |
| ranks parsers like their real errors | 25 × (L − 0.5) / 0.4, kept between 0 and 25, where L is the low end of agreement's 90% interval | 0.0/ 25 |
| a real error costs more than a format change | 5 × the share of error types whose cost rises with the error rate, plus 5 × min(1, R / 5), where R is the median cost of a real error at 5% divided by (the median cost of a format change + 1) | 0.0/ 10 |
| the ground truth is right | 10 if 1% or less of the checked facts are wrong, 7 if 3% or less, 4 if 6% or less, else 0 | 0.0/ 10 |
| the headline is about reading | 5 × the share of the headline that is reading: text, tables, formulas or layout | 5.0/ 5 |
| fair to every parser | 0.0/ 25 | |
| ranks hold under unstated conventions | 15 × (1 − the mean over the 7 models of how far each model's rank moves, out of 6) | 0.0/ 15 |
| no tests only one format can pass | 10 × (1 − the share of the headline that only one kind of output can pass) | 0.0/ 10 |
| you can run it | 0.0/ 15 | |
| runs as published | two raters score: test data public and complete (4), scorer runs as published (4), output rules documented (4) and inference code included (3) | 0.0/ 15 |
| separates parsers | 0.0/ 10 | |
| tells close parsers apart | 7 if the smallest score gap ordered right 80% of the time is 1 or less, down to 0 at 5 or more; plus 3 if the best model is 10 or more below the ceiling, 1.5 if 3 to 10 | 0.0/ 10 |
| penalties | 0.0 | |
| an empty or shuffled page keeps 80% of the score | −5 if an empty page, the PDF text layer alone or the ground truth with its blocks shuffled scores 80% or more of the ground truth's score | 0.0 |
| each bug that flips two parsers | −3 for each scoring bug that flips the order of two real parsers, −1 if fixed, at most −10 | 0.0 |
| test pages in a compared model's training data | −3 for public evidence that test pages were in a compared model's training data | 0.0 |
| total | 5.0/ 100 | |
What we found:
- Both keep their test data private, so nobody else can score a model, check a published number or look for ground-truth errors; and
- LogicsDocBench puts 43% of its headline on notations only some parsers write: SMILES, Mermaid and ABC music.
How to read them: as the builders’ own claims.
How much benchmarks agree with each other
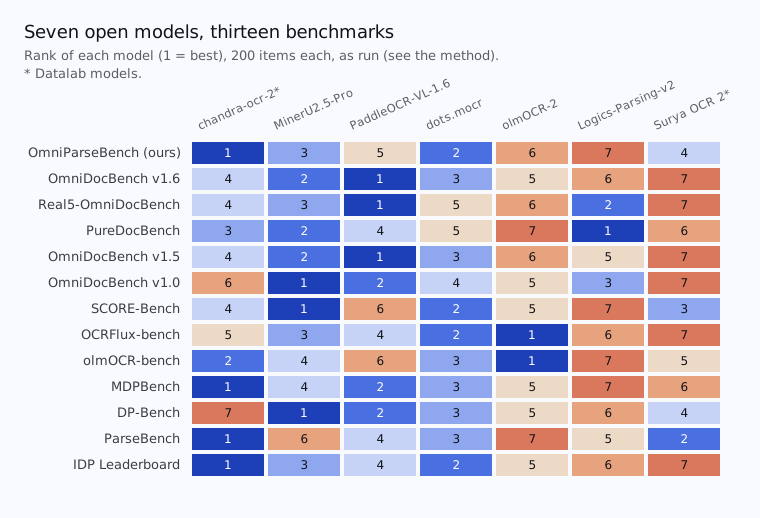
Two benchmarks agree only a little more often than a coin flip. Across the 78 pairs of benchmarks, they put a given pair of models in the same order about 59% of the time, and a coin flip gets 50%. Five different models come first on at least one benchmark.
Three things drive the disagreement:
- The benchmarks cover different documents, so some of it is real;
- Format and convention: olmOCR-bench wants page headers removed and OmniParseBench wants them kept, and on ParseBench only models that turn charts into tables score on charts; and
- Each builder’s model tends to do better on its own benchmark. With one or two benchmarks per builder, we can’t tell how much of that is conventions and how much is tuning.
Five checks before you trust a number
Each takes a few minutes. In parentheses: what we saw in our runs.
- Score the ground truth as if it were a parser’s output. It should score near 100 (OmniDocBench v1.5 scores every formula 0 without scikit-image);
- Make 5% of the digits wrong. The score should clearly drop (it drops 0.1 to 0.4 out of 100 on the edit-distance benchmarks);
- Write the same correct table in two formats, such as markdown and HTML, or compact and pretty-printed HTML. The score should move less than 1 out of 100 (pretty-printed HTML drops DP-Bench’s table score by 38);
- Leave out one page. The score should drop, or the scorer should warn you (the score doesn’t drop on 7 of the 13, and only some of them warn); and
- Read 20 failures against the page image. Most should be real errors (on OCRFlux-bench, a harmless format change moves the score more than real errors do).
Checking ourselves
We sell a parser, so we could be tempted to score a benchmark low when our products do badly on it. We tested for that:
- We took the eight benchmarks, besides ours, whose leaderboards list our products;
- For each, we compared where our best product places on its leaderboard with the benchmark’s score here; and
- If we were biased, benchmarks where we place badly would score low here.
The result goes the other way: benchmarks where we place badly tend to score higher here (a rank correlation of +0.66, where +1 means the two orders match exactly). With only eight benchmarks this could still be luck: there is an 8% chance of a link this strong by chance (p = 0.08). With OmniParseBench included, the link is much weaker (+0.15).
Most of the score comes from runs, error probes and judge counts, which don’t depend on who leads a leaderboard. We can’t rule out that our priorities favor benchmarks that look like ours.
Data
- The rubric: every rule, formula and change;
- The scores: each benchmark’s points for each check;
- The runs: each model’s score and rank on each benchmark, and on olmOCR-bench with headers left out;
- Agreement: each benchmark’s pairs in order and 90% interval;
- Agreement by model: each model’s mean page score and the judges’ mean errors per page on each benchmark, the two sides agreement compares;
- Ground truth checks: items, facts checked and facts wrong on each benchmark (one to three judges checked each item; we use the middle of three counts or the mean of two, so some counts end in .5);
- Error and format probes: how each benchmark’s score moves when we add an error or change the format; and
- Ratings: the four “you can run it” scores for each benchmark.