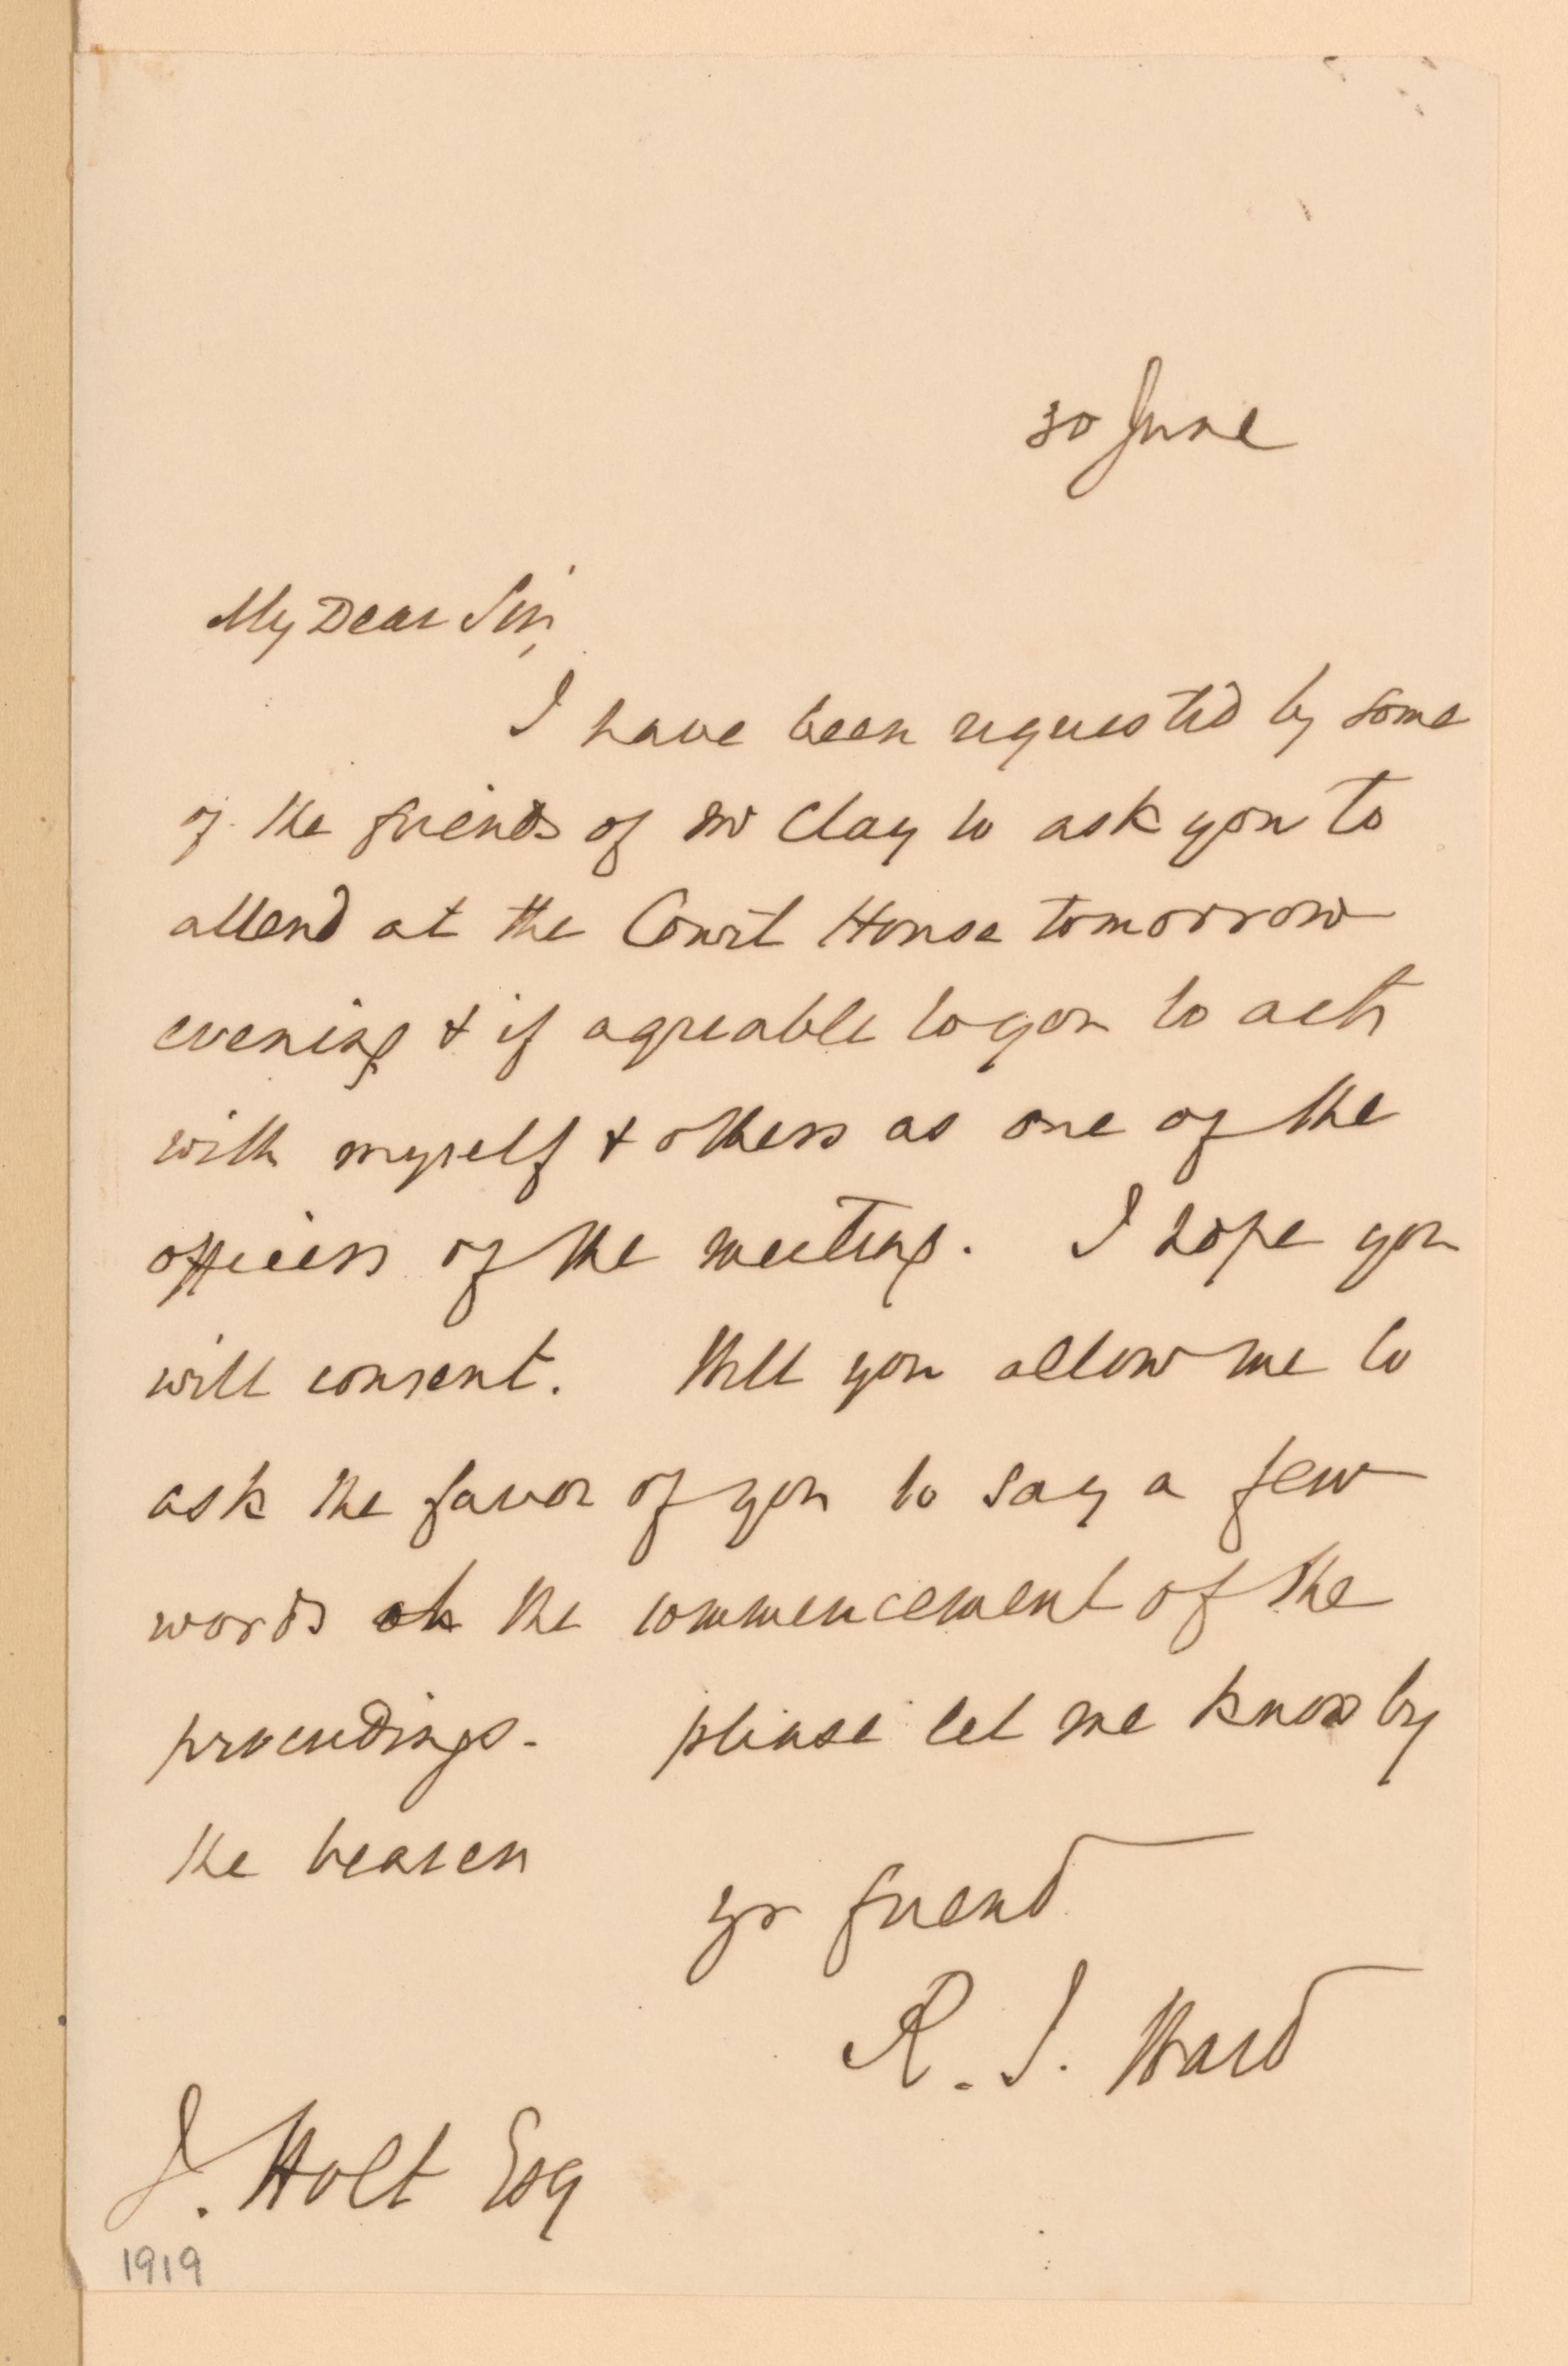
 _Library of Congress, Manuscript Division, [Joseph Holt Papers](https://www.loc.gov/item/mss263850015/). Letter from R. I. Ward to Joseph Holt, 30 June._
Let's see how a Datalab model transcribes the letter above. Along with the transcribed output, I selected the word bounding box option, which returns the location and confidence score for every word. The bounding box provides the coordinates of each word in the document, which is useful for displaying the location of the word during verification. The confidence score indicates how confident the model is in its prediction for that particular word. Let's see how this looks in the Datalab Playground.
_Library of Congress, Manuscript Division, [Joseph Holt Papers](https://www.loc.gov/item/mss263850015/). Letter from R. I. Ward to Joseph Holt, 30 June._
Let's see how a Datalab model transcribes the letter above. Along with the transcribed output, I selected the word bounding box option, which returns the location and confidence score for every word. The bounding box provides the coordinates of each word in the document, which is useful for displaying the location of the word during verification. The confidence score indicates how confident the model is in its prediction for that particular word. Let's see how this looks in the Datalab Playground.
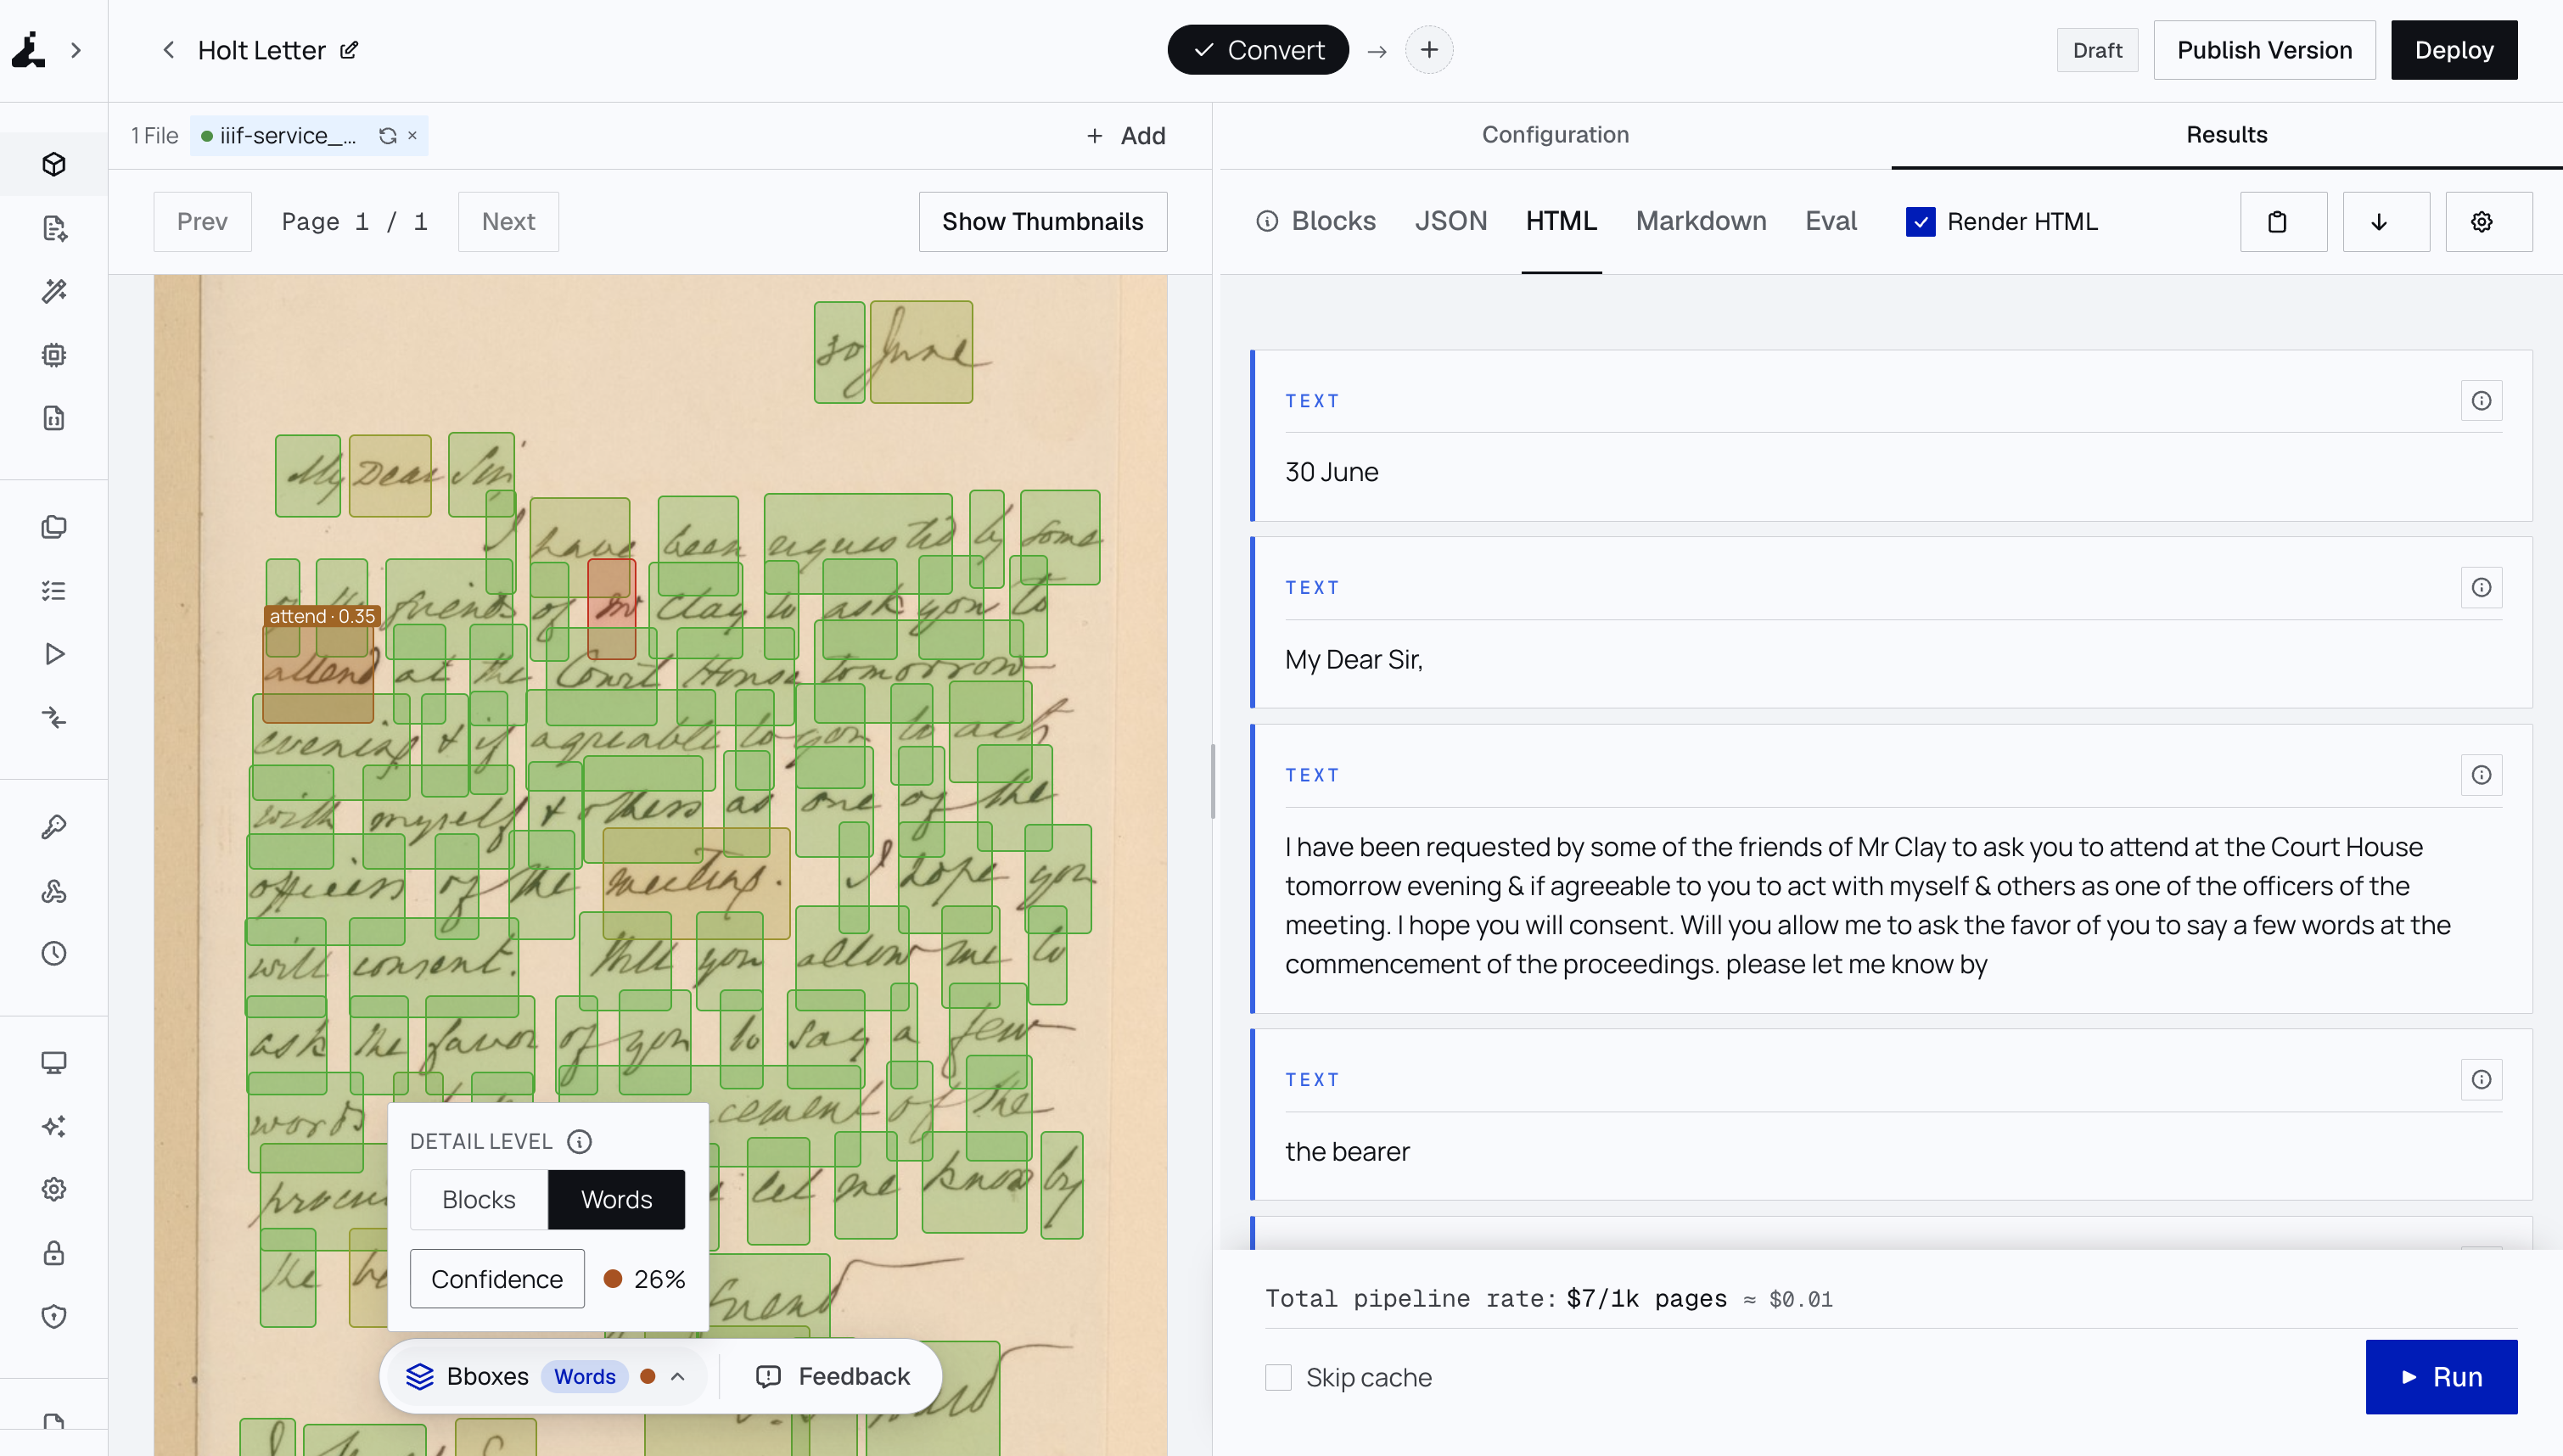 _The Holt letter in the Datalab Playground at the Words detail level. Most words are boxed in green; "attend" is labeled 0.35 and "Mr" is boxed in red. The rendered HTML on the right reads the passage as "ask you to attend at the Court House tomorrow evening." Letter: Library of Congress, Manuscript Division, [Joseph Holt Papers](https://www.loc.gov/item/mss263850015/). Boxes, scores and HTML are Datalab output._
Notice in the image that the word "attend" has a confidence score of 0.35. This means that the model is not particularly confident in its prediction for that word. But viewing the word in context of the broader passage, as seen on the right side of the image, we can feel more confident that the model is making a good prediction for that word. If you'd like to learn more about Datalab's word bounding boxes and confidence scores, check out [this blog post](/blog/word-bounding-boxes-and-confidence) as well as this follow-up [blog post](/blog/word-bboxes-degradation-density-rotation).
Next up, let's see how to return word bounding boxes and confidence scores for a document using the Datalab Convert API.
## How do we use the Datalab Convert API to return word bounding boxes and confidence scores?
The Datalab Playground is a great way to experiment with the Datalab Convert API. But to build our own AI document system, we need to use the API directly. We'll use the REST API to specify that we want to return word bounding boxes and confidence scores. Word bounding boxes are enabled by setting `word_bboxes` to `"true"`.
See the [Document Conversion documentation](https://documentation.datalab.to/docs/recipes/conversion/conversion-api-overview) for a general overview of the Datalab Convert API. Check out the [Bounding Box Add-ons](https://documentation.datalab.to/docs/recipes/conversion/conversion-api-overview#bounding-box-add-ons) section of the documentation for enabling word bounding boxes and confidence scores.
I won't get into the details of the syntax, but here's the code I used to convert the handwriting example image to HTML with word bounding boxes and confidence scores:
```python
import os
import time
from pathlib import Path
from urllib.parse import urlsplit
import httpx
API_URL = "https://www.datalab.to/api/v1/convert"
OPTIONS = {"output_format": "html", "mode": "balanced", "word_bboxes": "true"}
image = Path(__file__).with_name("handwriting-example.jpg")
def convert():
headers = {"X-API-Key": os.environ["DATALAB_API_KEY"]}
# Submit once. If submission times out, reconcile it before submitting again.
with image.open("rb") as source:
response = httpx.post(
API_URL,
files={"file": (image.name, source, "image/jpeg")},
data=OPTIONS,
headers=headers,
timeout=60,
)
response.raise_for_status()
submission = response.json()
if submission.get("success") is not True:
raise RuntimeError("Conversion submission failed")
print(f"Request ID: {submission['request_id']}", flush=True)
check_url = submission["request_check_url"]
if urlsplit(check_url)[:2] != urlsplit(API_URL)[:2]:
raise RuntimeError("Unexpected polling origin; refusing to send API key")
# Bound polling to ten minutes; every HTTP request also has a timeout.
deadline = time.monotonic() + 600
while time.monotonic() < deadline:
response = httpx.get(check_url, headers=headers, timeout=60)
response.raise_for_status()
result = response.json()
if result.get("success") is False or result.get("status") == "failed":
raise RuntimeError("Document processing failed")
if result.get("status") == "complete":
if result.get("result_url"):
# The signed URL authorizes the download; do not send the API key.
download = httpx.get(result["result_url"], timeout=60)
download.raise_for_status()
result = {
**download.json(),
**{key: value for key, value in result.items() if value is not None},
}
if result.get("success") is not True:
raise RuntimeError("Conversion did not report success")
html = result.get("html")
if not isinstance(html, str) or not html.strip():
raise RuntimeError("Conversion returned no HTML")
output = image.with_suffix(".html")
output.write_text(html, encoding="utf-8")
print(f"Saved {output}")
return submission, result
time.sleep(2)
raise TimeoutError(f"Polling timed out for request {submission['request_id']}")
if __name__ == "__main__":
convert()
```
Notice below that every word has a `data-bbox` and `data-confidence` attribute, which are used to display the word bounding boxes and confidence scores in the HTML output. In this case, conversion through the REST API instead of the Playground returned a confidence score of about 0.33 for the word "attend", which is slightly lower than the score of 0.35 returned by the Playground. Expect some variation in confidence scores between model runs.
```html
attend
```
Here's an excerpt from the full HTML output, showing the bounding box and confidence scores for some of the words in the document:
```html
_The Holt letter in the Datalab Playground at the Words detail level. Most words are boxed in green; "attend" is labeled 0.35 and "Mr" is boxed in red. The rendered HTML on the right reads the passage as "ask you to attend at the Court House tomorrow evening." Letter: Library of Congress, Manuscript Division, [Joseph Holt Papers](https://www.loc.gov/item/mss263850015/). Boxes, scores and HTML are Datalab output._
Notice in the image that the word "attend" has a confidence score of 0.35. This means that the model is not particularly confident in its prediction for that word. But viewing the word in context of the broader passage, as seen on the right side of the image, we can feel more confident that the model is making a good prediction for that word. If you'd like to learn more about Datalab's word bounding boxes and confidence scores, check out [this blog post](/blog/word-bounding-boxes-and-confidence) as well as this follow-up [blog post](/blog/word-bboxes-degradation-density-rotation).
Next up, let's see how to return word bounding boxes and confidence scores for a document using the Datalab Convert API.
## How do we use the Datalab Convert API to return word bounding boxes and confidence scores?
The Datalab Playground is a great way to experiment with the Datalab Convert API. But to build our own AI document system, we need to use the API directly. We'll use the REST API to specify that we want to return word bounding boxes and confidence scores. Word bounding boxes are enabled by setting `word_bboxes` to `"true"`.
See the [Document Conversion documentation](https://documentation.datalab.to/docs/recipes/conversion/conversion-api-overview) for a general overview of the Datalab Convert API. Check out the [Bounding Box Add-ons](https://documentation.datalab.to/docs/recipes/conversion/conversion-api-overview#bounding-box-add-ons) section of the documentation for enabling word bounding boxes and confidence scores.
I won't get into the details of the syntax, but here's the code I used to convert the handwriting example image to HTML with word bounding boxes and confidence scores:
```python
import os
import time
from pathlib import Path
from urllib.parse import urlsplit
import httpx
API_URL = "https://www.datalab.to/api/v1/convert"
OPTIONS = {"output_format": "html", "mode": "balanced", "word_bboxes": "true"}
image = Path(__file__).with_name("handwriting-example.jpg")
def convert():
headers = {"X-API-Key": os.environ["DATALAB_API_KEY"]}
# Submit once. If submission times out, reconcile it before submitting again.
with image.open("rb") as source:
response = httpx.post(
API_URL,
files={"file": (image.name, source, "image/jpeg")},
data=OPTIONS,
headers=headers,
timeout=60,
)
response.raise_for_status()
submission = response.json()
if submission.get("success") is not True:
raise RuntimeError("Conversion submission failed")
print(f"Request ID: {submission['request_id']}", flush=True)
check_url = submission["request_check_url"]
if urlsplit(check_url)[:2] != urlsplit(API_URL)[:2]:
raise RuntimeError("Unexpected polling origin; refusing to send API key")
# Bound polling to ten minutes; every HTTP request also has a timeout.
deadline = time.monotonic() + 600
while time.monotonic() < deadline:
response = httpx.get(check_url, headers=headers, timeout=60)
response.raise_for_status()
result = response.json()
if result.get("success") is False or result.get("status") == "failed":
raise RuntimeError("Document processing failed")
if result.get("status") == "complete":
if result.get("result_url"):
# The signed URL authorizes the download; do not send the API key.
download = httpx.get(result["result_url"], timeout=60)
download.raise_for_status()
result = {
**download.json(),
**{key: value for key, value in result.items() if value is not None},
}
if result.get("success") is not True:
raise RuntimeError("Conversion did not report success")
html = result.get("html")
if not isinstance(html, str) or not html.strip():
raise RuntimeError("Conversion returned no HTML")
output = image.with_suffix(".html")
output.write_text(html, encoding="utf-8")
print(f"Saved {output}")
return submission, result
time.sleep(2)
raise TimeoutError(f"Polling timed out for request {submission['request_id']}")
if __name__ == "__main__":
convert()
```
Notice below that every word has a `data-bbox` and `data-confidence` attribute, which are used to display the word bounding boxes and confidence scores in the HTML output. In this case, conversion through the REST API instead of the Playground returned a confidence score of about 0.33 for the word "attend", which is slightly lower than the score of 0.35 returned by the Playground. Expect some variation in confidence scores between model runs.
```html
attend
```
Here's an excerpt from the full HTML output, showing the bounding box and confidence scores for some of the words in the document:
```html
30 June
My Dear Sir,
I have Mr attend evening act meeting. at proceedings.
the bearer
your friend
R. J. Ward
J. Holt Esq
1919
``` Using the HTML output, we can flag and route for review words that require a human look. The bounding box coordinates enable us to display the words that require attention in an application. ## Which words should we send for review? Selecting which words to send for review is determined by the threshold that you or your team set. In this example, we set the threshold to 0.9, and 18 of 89 words fell below 0.9. Ultimately, you will need to determine and refine the threshold that works best for your use case through iteration and review. Take a look at the results below and compare to the original image. Do you agree with the words that require review? Can you verify they're accurate? | Returned word | Confidence | Source box | | ------------- | ---------- | ------------------- | | June | 0.636 | 1445 448 1659 656 | | Dear | 0.588 | 394 717 562 882 | | Sir, | 0.841 | 594 711 729 882 | | I | 0.877 | 670 827 733 1037 | | have | 0.716 | 758 842 962 1043 | | Mr | 0.057 | 874 964 974 1168 | | attend | 0.328 | 220 1095 445 1294 | | evening | 0.896 | 198 1233 519 1449 | | act | 0.897 | 1604 1208 1772 1413 | | meeting. | 0.521 | 905 1501 1285 1715 | | at | 0.843 | 482 1989 586 2194 | | proceedings. | 0.87 | 212 2133 707 2350 | | bearer | 0.58 | 394 2301 694 2502 | | your | 0.871 | 909 2359 1101 2588 | | R. | 0.687 | 993 2496 1332 2795 | | J. | 0.841 | 1285 2520 1420 2777 | | Ward | 0.892 | 1436 2527 1708 2777 | | Esq | 0.601 | 607 2682 774 2945 | So far we've looked at how to interpret word bounding boxes and confidence scores for standard text layouts. Next up, let's look at how we can locate words and return confidence scores for data living in tables. ## How do we calculate confidence scores for table cells? Realistically, we'll need to build AI document systems that handle tabular layouts as well. And to verify the results when a low-confidence score is returned for a table cell we'll benefit from having bounding box coordinates available. Let's take a look at an example of a document that includes a mix of handwritten words and data laid out in a table. The datasheet records monthly rainfall for 1941-1950 for a location in the UK.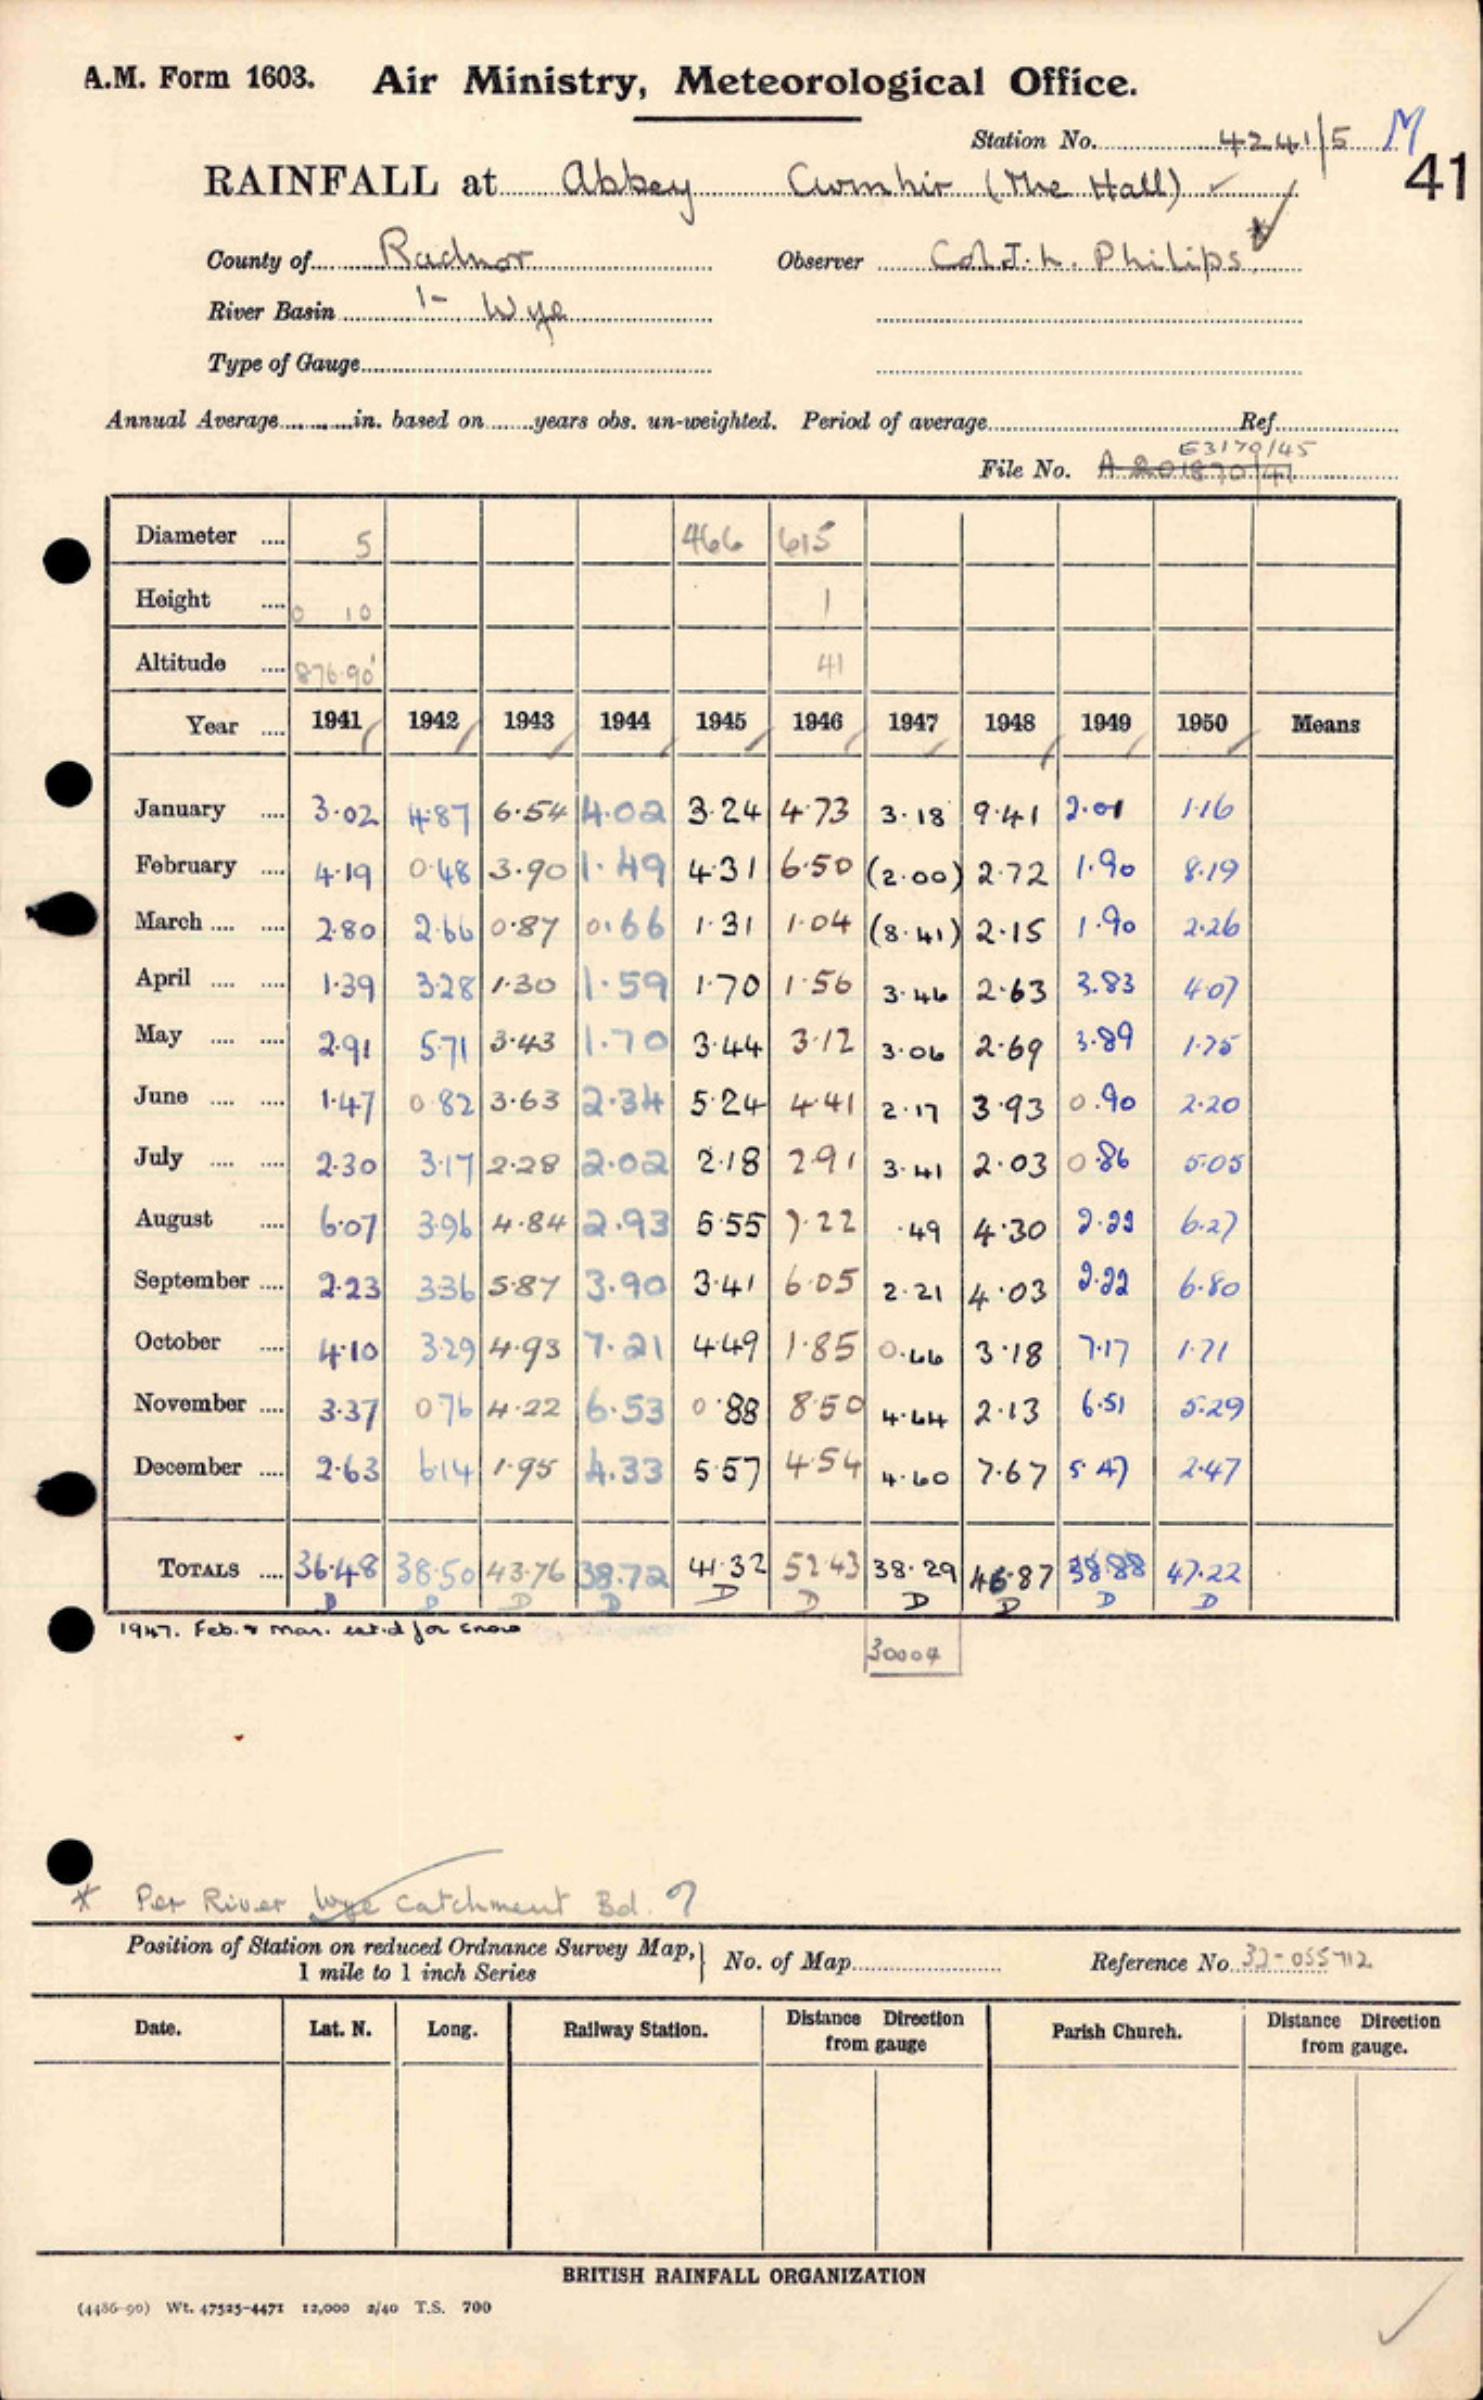 _Air Ministry, Meteorological Office form 1603: monthly rainfall at Abbey Cwmhir (The Hall), Radnor, for 1941–1950, handwritten in black and blue ink on a printed grid. National Meteorological Library and Archive, Met Office, UK: [source volume](https://digital.nmla.metoffice.gov.uk/IO_9cd586ac-1fd8-4d3d-9409-41407db9da76/), viewer page 137; [acknowledgement](https://www.metoffice.gov.uk/research/library-and-archive/ogl-acknowledgement), [OGL v3.0](https://www.nationalarchives.gov.uk/doc/open-government-licence/version/3/). Reference values: [Rainfall Rescue transcription](https://github.com/ed-hawkins/rainfall-rescue/blob/master/DATA/ABBEY-CWMHIR-THE-HALL/TYRain_1941-1950_26_pt1-page-137.csv)._
Once again we'll use the REST API to convert the PDF and return the bounding boxes and confidence scores. But this time we'll specify `"extras": "table_cell_bboxes,list_item_bboxes"` to get the bounding boxes for table cells and list items. Check out the [documentation](https://documentation.datalab.to/docs/recipes/conversion/conversion-api-overview#bounding-box-add-ons) to learn more. I don't expect to see any list-item results returned in this case. Here's the code I used:
```python
import json
from pathlib import Path
from rest import request
source = Path(__file__).with_name("uk-rainfall-abbey.pdf")
result = request("convert", {
"page_range": "1", # PDF page 2 (zero-indexed).
"mode": "balanced",
"output_format": "html,json",
"word_bboxes": "true",
"extras": "table_cell_bboxes,list_item_bboxes",
"add_block_ids": "true",
"save_checkpoint": "true",
"disable_image_captions": "true",
"skip_cache": "true",
}, source)
Path("rain-convert.json").write_text(json.dumps(result, indent=2), encoding="utf-8")
Path("rain.html").write_text(result["html"], encoding="utf-8")
```
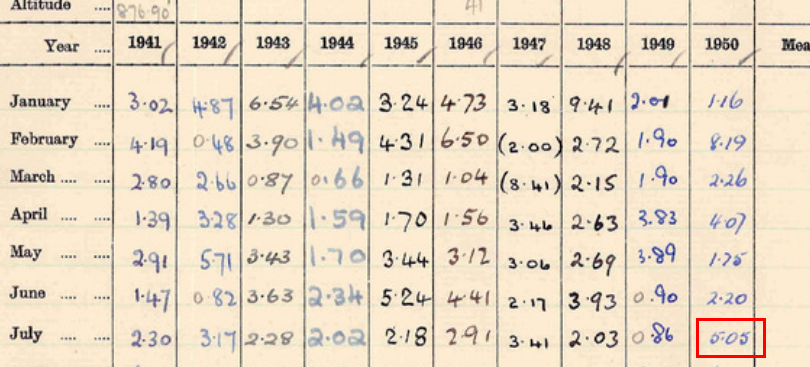
In this case, the full HTML output was written to a file called `rain.html`. I won't show the full output here because it's extensive. But I'll highlight one interesting thing from the results. The OCR model returned a confidence score of 0.965 for the "July 1950" cell, stating the value was 0.05" for the month. Check that against the original image. Does that value seem right to you?
```html
_Air Ministry, Meteorological Office form 1603: monthly rainfall at Abbey Cwmhir (The Hall), Radnor, for 1941–1950, handwritten in black and blue ink on a printed grid. National Meteorological Library and Archive, Met Office, UK: [source volume](https://digital.nmla.metoffice.gov.uk/IO_9cd586ac-1fd8-4d3d-9409-41407db9da76/), viewer page 137; [acknowledgement](https://www.metoffice.gov.uk/research/library-and-archive/ogl-acknowledgement), [OGL v3.0](https://www.nationalarchives.gov.uk/doc/open-government-licence/version/3/). Reference values: [Rainfall Rescue transcription](https://github.com/ed-hawkins/rainfall-rescue/blob/master/DATA/ABBEY-CWMHIR-THE-HALL/TYRain_1941-1950_26_pt1-page-137.csv)._
Once again we'll use the REST API to convert the PDF and return the bounding boxes and confidence scores. But this time we'll specify `"extras": "table_cell_bboxes,list_item_bboxes"` to get the bounding boxes for table cells and list items. Check out the [documentation](https://documentation.datalab.to/docs/recipes/conversion/conversion-api-overview#bounding-box-add-ons) to learn more. I don't expect to see any list-item results returned in this case. Here's the code I used:
```python
import json
from pathlib import Path
from rest import request
source = Path(__file__).with_name("uk-rainfall-abbey.pdf")
result = request("convert", {
"page_range": "1", # PDF page 2 (zero-indexed).
"mode": "balanced",
"output_format": "html,json",
"word_bboxes": "true",
"extras": "table_cell_bboxes,list_item_bboxes",
"add_block_ids": "true",
"save_checkpoint": "true",
"disable_image_captions": "true",
"skip_cache": "true",
}, source)
Path("rain-convert.json").write_text(json.dumps(result, indent=2), encoding="utf-8")
Path("rain.html").write_text(result["html"], encoding="utf-8")
```
In this case, the full HTML output was written to a file called `rain.html`. I won't show the full output here because it's extensive. But I'll highlight one interesting thing from the results. The OCR model returned a confidence score of 0.965 for the "July 1950" cell, stating the value was 0.05" for the month. Check that against the original image. Does that value seem right to you?
```html
 _National Meteorological Library and Archive, Met Office, UK: [source volume](https://digital.nmla.metoffice.gov.uk/IO_9cd586ac-1fd8-4d3d-9409-41407db9da76/), viewer page 137; [acknowledgement](https://www.metoffice.gov.uk/research/library-and-archive/ogl-acknowledgement), [OGL v3.0](https://www.nationalarchives.gov.uk/doc/open-government-licence/version/3/). Cropped; red box added. HTML is Datalab output._
It turns out the actual recorded rainfall for July 1950 at this location was 5.05 inches. In this case, I was able to verify the result against the reference transcription.
This example raises an important point. Confidence scores add a layer of defense against OCR hallucinations, but a high confidence score doesn't mean the result is certain. The confidence score wasn't 1.0, after all. The takeaway is that for critical data it's best to combine confidence scores with some level of human verification to ensure the results are accurate.
Aside from this one value, the Datalab OCR model transcribed the rain data correctly. Here's a look at the raw HTML output rendered locally in a browser.
_National Meteorological Library and Archive, Met Office, UK: [source volume](https://digital.nmla.metoffice.gov.uk/IO_9cd586ac-1fd8-4d3d-9409-41407db9da76/), viewer page 137; [acknowledgement](https://www.metoffice.gov.uk/research/library-and-archive/ogl-acknowledgement), [OGL v3.0](https://www.nationalarchives.gov.uk/doc/open-government-licence/version/3/). Cropped; red box added. HTML is Datalab output._
It turns out the actual recorded rainfall for July 1950 at this location was 5.05 inches. In this case, I was able to verify the result against the reference transcription.
This example raises an important point. Confidence scores add a layer of defense against OCR hallucinations, but a high confidence score doesn't mean the result is certain. The confidence score wasn't 1.0, after all. The takeaway is that for critical data it's best to combine confidence scores with some level of human verification to ensure the results are accurate.
Aside from this one value, the Datalab OCR model transcribed the rain data correctly. Here's a look at the raw HTML output rendered locally in a browser.
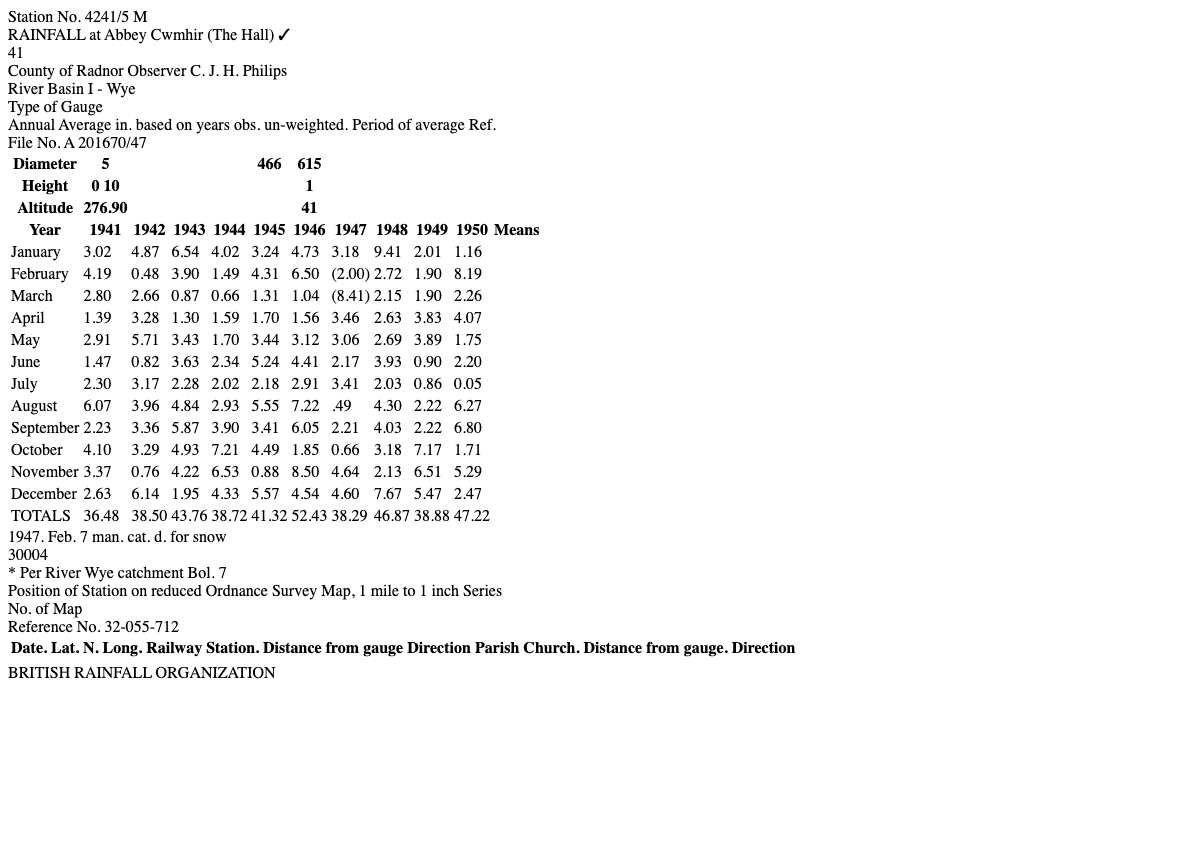 _Local browser screenshot of rendered HTML from the Datalab OCR model. Not a Datalab Playground screenshot._
Later in the post we'll see a surprising result where changing the file input type for this rainfall data brings the Datalab OCR model to 100% accuracy. For now though, let's turn our attention to list items.
## How do bounding boxes apply to list items?
We've seen that adding bounding boxes and confidence scores to standard text and tabular data is useful for flagging values that need further review. And for this reason Datalab also supports bounding boxes for list items.
The same concepts we've covered apply to bounding boxes and confidence scores for list items. For each list item, the model returns the results as HTML. We don't need to spend much time on this, but it's worth showing the value of this functionality with an example.
Notice how this page has three sets of lists across two sections, or sub-pages.
_Local browser screenshot of rendered HTML from the Datalab OCR model. Not a Datalab Playground screenshot._
Later in the post we'll see a surprising result where changing the file input type for this rainfall data brings the Datalab OCR model to 100% accuracy. For now though, let's turn our attention to list items.
## How do bounding boxes apply to list items?
We've seen that adding bounding boxes and confidence scores to standard text and tabular data is useful for flagging values that need further review. And for this reason Datalab also supports bounding boxes for list items.
The same concepts we've covered apply to bounding boxes and confidence scores for list items. For each list item, the model returns the results as HTML. We don't need to spend much time on this, but it's worth showing the value of this functionality with an example.
Notice how this page has three sets of lists across two sections, or sub-pages.
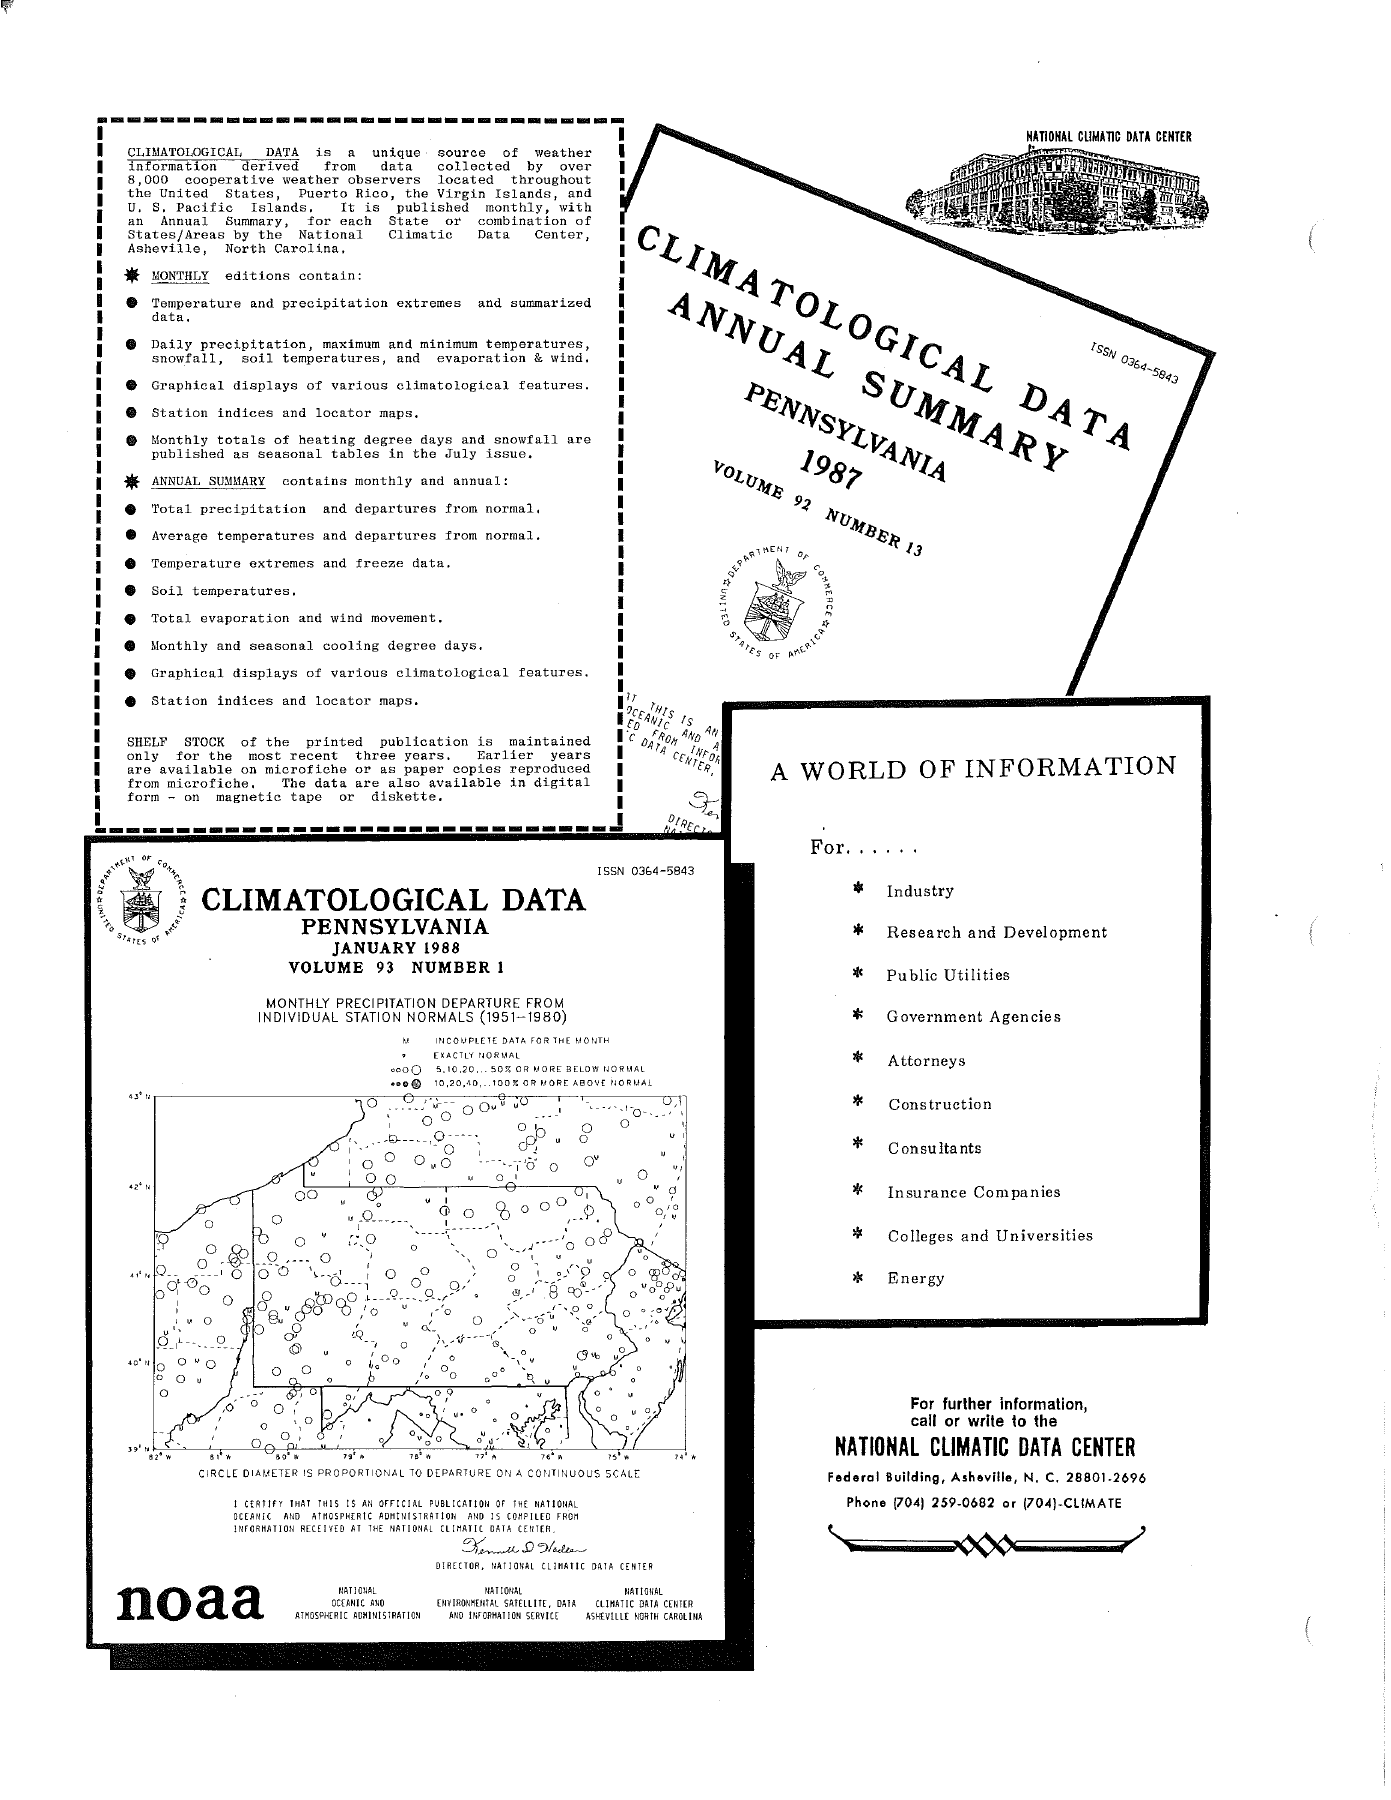 _Three lists on one page: the monthly and annual editions' bulleted contents on the left, and an asterisked audience list on the right, around rotated cover art and a precipitation map. NOAA, National Climatic Data Center (1988), [Cooperative observers climatological observations: sample WS form E-15](https://repository.library.noaa.gov/view/noaa/14289), page 4. Public domain._
Here's the code we use to convert the PDF page to HTML.
```python
import base64
import json
from pathlib import Path
from rest import request
source = Path(__file__).with_name("noaa-john-doe-weather-form.pdf")
result = request("convert", {
"page_range": "3", # PDF page 4 (zero-indexed).
"mode": "balanced",
"output_format": "html,json",
"word_bboxes": "true",
"extras": "table_cell_bboxes,list_item_bboxes",
"add_block_ids": "true",
"save_checkpoint": "true",
"disable_image_captions": "true",
"skip_cache": "true",
}, source)
Path("noaa-convert.json").write_text(json.dumps(result, indent=2), encoding="utf-8")
Path("noaa.html").write_text(result["html"], encoding="utf-8")
for filename, data in (result.get("images") or {}).items():
if Path(filename).name != filename:
raise ValueError("Unexpected image filename")
Path(filename).write_bytes(base64.b64decode(data, validate=True))
```
And here's how the raw HTML looks for the list item pictured below.
```html
_Three lists on one page: the monthly and annual editions' bulleted contents on the left, and an asterisked audience list on the right, around rotated cover art and a precipitation map. NOAA, National Climatic Data Center (1988), [Cooperative observers climatological observations: sample WS form E-15](https://repository.library.noaa.gov/view/noaa/14289), page 4. Public domain._
Here's the code we use to convert the PDF page to HTML.
```python
import base64
import json
from pathlib import Path
from rest import request
source = Path(__file__).with_name("noaa-john-doe-weather-form.pdf")
result = request("convert", {
"page_range": "3", # PDF page 4 (zero-indexed).
"mode": "balanced",
"output_format": "html,json",
"word_bboxes": "true",
"extras": "table_cell_bboxes,list_item_bboxes",
"add_block_ids": "true",
"save_checkpoint": "true",
"disable_image_captions": "true",
"skip_cache": "true",
}, source)
Path("noaa-convert.json").write_text(json.dumps(result, indent=2), encoding="utf-8")
Path("noaa.html").write_text(result["html"], encoding="utf-8")
for filename, data in (result.get("images") or {}).items():
if Path(filename).name != filename:
raise ValueError("Unexpected image filename")
Path(filename).write_bytes(base64.b64decode(data, validate=True))
```
And here's how the raw HTML looks for the list item pictured below.
```html
 _NOAA, National Climatic Data Center (1988), [Cooperative observers climatological observations: sample WS form E-15](https://repository.library.noaa.gov/view/noaa/14289), page 4. Public domain. Cropped; red overlay added. HTML is Datalab output._
Here's the complete result rendered as HTML. Note that the original images in the PDF are captured by the Datalab API and saved alongside the HTML by the program.
_NOAA, National Climatic Data Center (1988), [Cooperative observers climatological observations: sample WS form E-15](https://repository.library.noaa.gov/view/noaa/14289), page 4. Public domain. Cropped; red overlay added. HTML is Datalab output._
Here's the complete result rendered as HTML. Note that the original images in the PDF are captured by the Datalab API and saved alongside the HTML by the program.
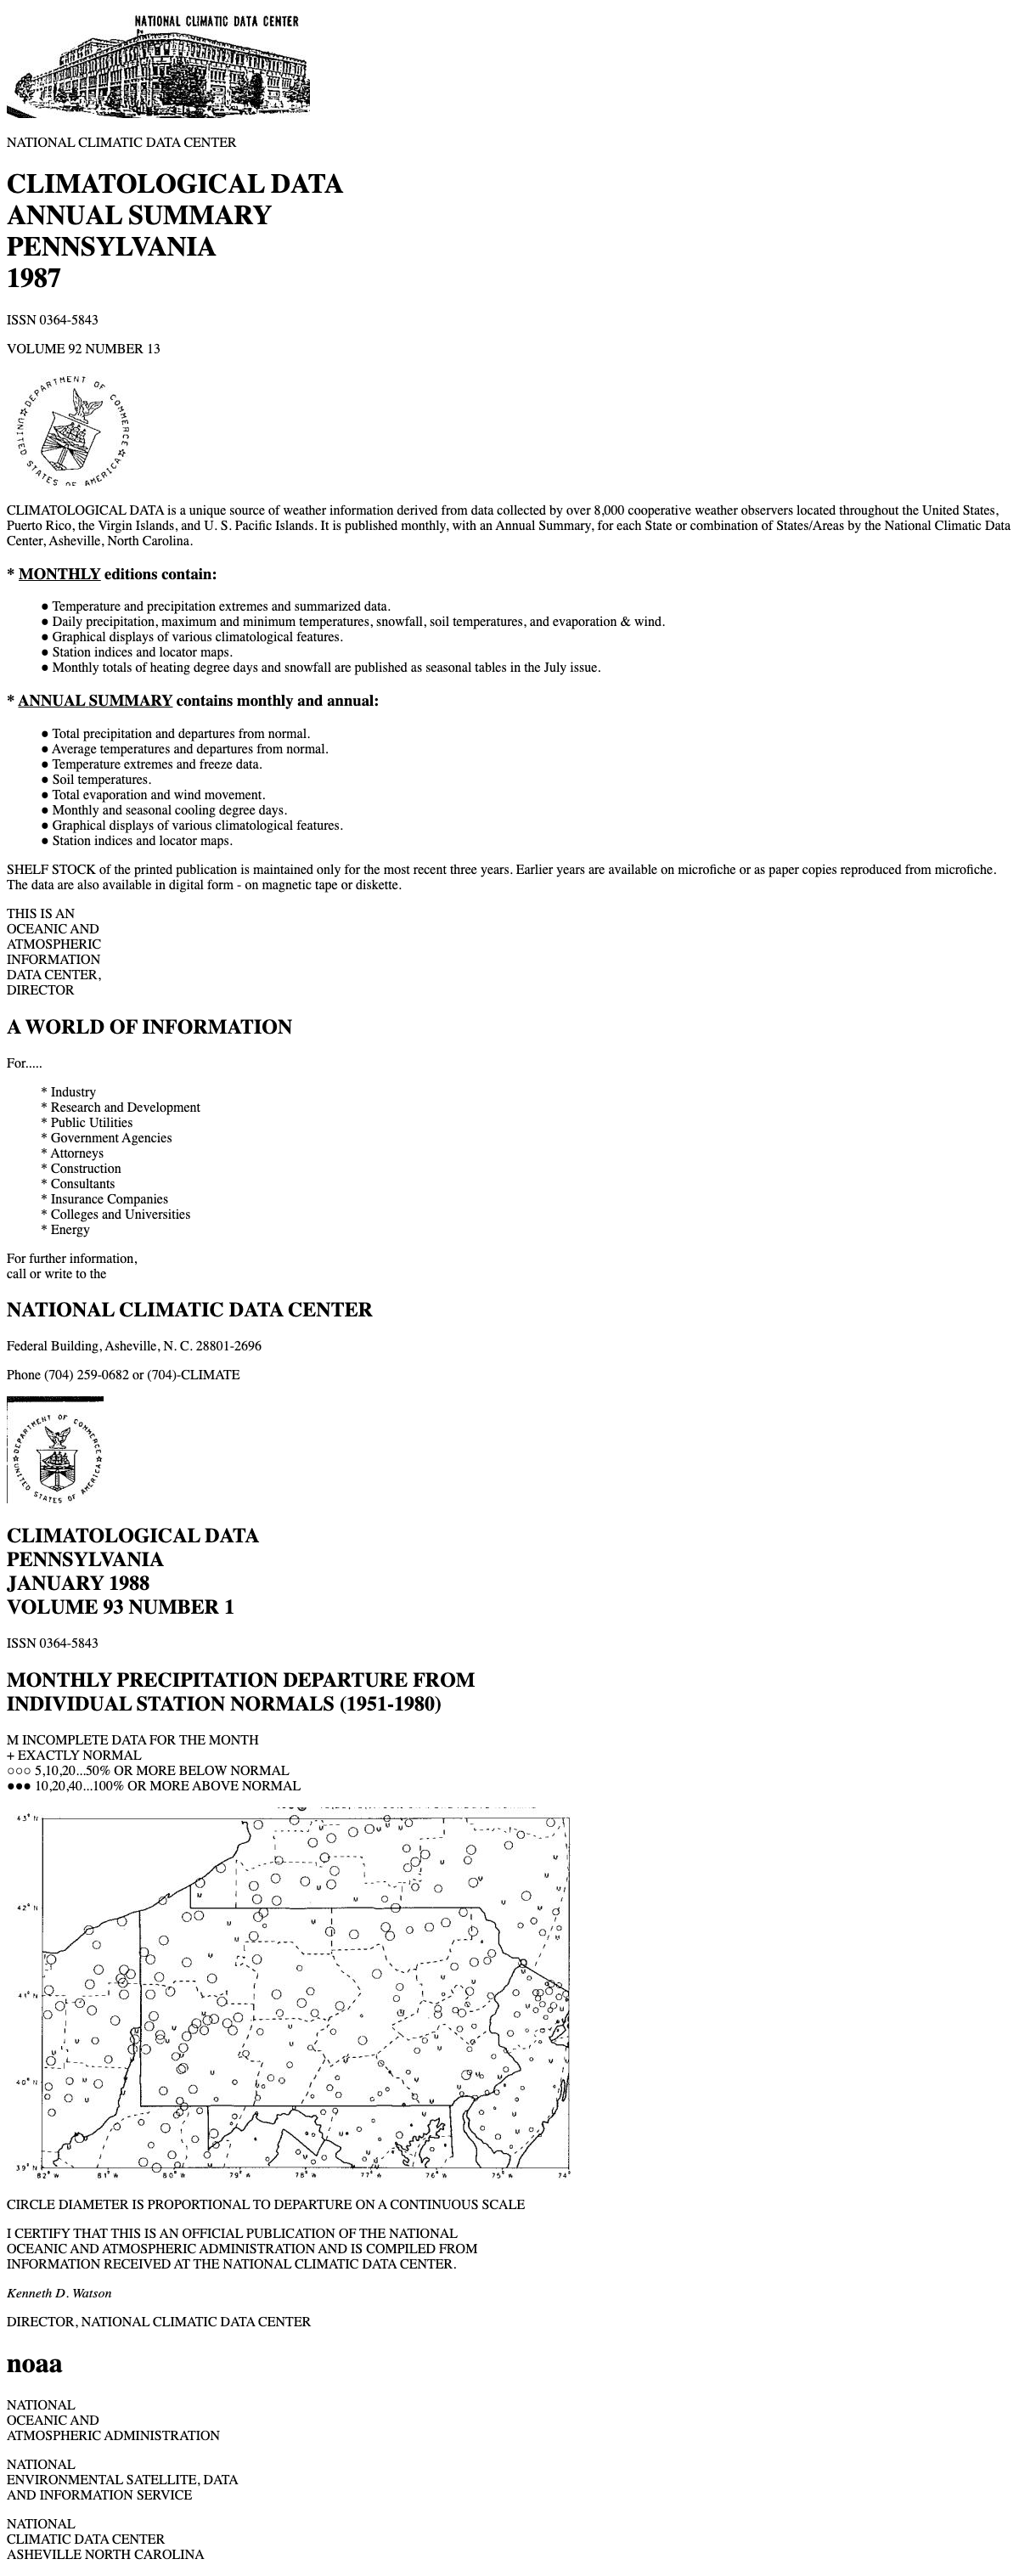 _The rotated cover title comes back as straight headings, the three lists as three HTML lists (23 items), and the building, seals and map as extracted images. Local browser screenshot of rendered HTML from the Datalab OCR model. Not a Datalab Playground screenshot._
## How do general-purpose LLMs compare to the Datalab Convert API?
Throughout this post we've seen that bounding boxes and confidence scores are useful for flagging uncertain values in converted documents. But how well do general-purpose LLMs perform on OCR conversion? General-purpose LLMs won't return word bounding boxes and confidence scores by default, so we won't be able to flag and review uncertain values like we do with the Datalab Convert API.
I wanted to compare how the Datalab Convert API stacks up against Claude, Gemini, and GPT models. Claude Code CLI and Codex CLI are the two harnesses I use daily for coding, so I set up an experiment to compare a couple models from each provider. As for Gemini, I used the Antigravity CLI harness which isn't one of my daily drivers, but I often use Gemini Flash models for vision tasks.
For each of Anthropic and OpenAI, I selected one "workhorse" model and one frontier model to compare against the Datalab Convert API in "balanced" and "accurate" mode ([accurate mode](/blog/high-accuracy-update) is used for the hardest OCR conversion cases). For Gemini, I only went with Gemini 3.6 Flash, the latest version of the model I have access to.
Here are the models I compared to Datalab:
- Claude Sonnet 5
- Claude Opus 5.5
- GPT-6 Luna
- GPT-6 Astra
- Gemini 3.6 Flash
This is not a formal evaluation. It's more like a vibe check, or an initial investigation into how well general-purpose LLMs perform on OCR conversion. The results here could be useful for deciding which providers and models would be worth coding up an API script for making direct calls to the model API, instead of running the OCR conversion through a coding harness. First up, we'll look at the results for each model without tool calls, like zooming and cropping. Think of it roughly like how well a model can transcribe values through OCR alone.
**Without tool calls**
| System (reasoning effort or mode) | Cells correct (of 360, over 3 runs) | Read the faint July 1950 value correctly as 5.05? | Median latency | Cost per page* | Cost per 1,000 pages* |
| --------------------------------- | ----------------------------------- | ------------------------------------------------- | -------------- | -------------- | --------------------- |
| Datalab (balanced) | 360 | ✅ ✅ ✅ | 24 s | 0.4¢ | $4 |
| Datalab (accurate) | 360 | ✅ ✅ ✅ | 33 s | 1.0¢ | $10 |
| Claude Opus 5.5 (Medium) | 354 | ❌ ❌ ❌ (read 6.05 every run) | 24 s | 7.5¢ | $75 |
| GPT-6 Astra (Medium) | 353 | ❌ ❌ ✅ (read 0.05 twice) | 87 s | 19.7¢ | $197 |
| Claude Sonnet 5 (High) | 351 | ✅ ✅ ✅ | 51 s | 8.5¢ | $85 |
| Gemini 3.6 Flash (High) | 350 | ✅ ✅ ❌ (read 0.05 once) | 34 s | 13.2¢ | $132 |
| GPT-6 Luna (Medium) | 340 | ✅ ✅ ✅ | 50 s | 0.16¢ | $1.60 |
_\* LLM costs are estimates based on token usage. Datalab costs are the published Convert rates. Word, table-cell, and list bounding boxes with confidence scores add $3–$9 per 1,000 pages._
Interestingly, the July 1950 value of 5.05 inches of precipitation caused problems for other models as well. Claude Opus consistently read the value as 6.05, while GPT-6 Astra read it as 0.05 two of three times. Notice that Astra and Gemini answers varied between runs, despite using the same image and prompt, while Datalab returned the same values every time.
Here's where the surprise came. For both the balanced and accurate modes, the Datalab model read the value correctly every time despite reading the value incorrectly as 0.05 earlier. I'll explain why later in the post. For now, take a look at the quality, latency, and cost for each model we tested.
The Datalab Convert API returned the highest accuracy in both balanced and accurate mode, and at costs lower than all other models except for GPT-6 Luna. But Luna had the lowest overall accuracy of all models and consistently returned the most misread values.
After seeing these results I was curious if tool use, like cropping and zooming, improves OCR conversion performance for general-purpose LLMs, so we'll look at that next.
## Does tool calling improve OCR conversion and reduce hallucinations for general-purpose LLMs?
When allowing tool calls, like cropping and zooming, the general-purpose LLMs would generally prefer to use them over native OCR alone. This is where model behavior differs from model to model.
Most fascinating to me was that despite being more expensive per token, Opus 5.5 ended up being cheaper and faster than Sonnet 5 because Sonnet went heavy on the tool use. Really heavy. Opus would sometimes cut the image into a few bands but then quickly return its analysis. Sonnet on the other hand made heavy use of image processing tools like cropping, zooming, and finding table grid lines, often making dozens of tool calls per run.
Astra and Gemini Flash consistently used cropping and zooming techniques during their analysis, whereas Luna generally made very few tool calls.
**With tool calls**
| System (reasoning effort) | Cells correct (of 360, over 3 runs) | Read the faint July 1950 value correctly as 5.05? | Median latency | Cost per page* | Cost per 1,000 pages* |
| ------------------------- | ----------------------------------- | ------------------------------------------------- | -------------- | -------------- | --------------------- |
| Claude Opus 5.5 (Medium) | 358 | ✅ ✅ ✅ | 48 s | 34¢ | $340 |
| Claude Sonnet 5 (High) | 356 | ✅ ✅ ✅ | 608 s (10 min) | $2.47 | $2,467 |
| GPT-6 Astra (Medium) | 352 | ❌ ❌ ❌ (read 0.05 every run) | 148 s | 62¢ | $623 |
| Gemini 3.6 Flash (High) | 352 | ✅ ✅ ✅ | 258 s | 29.3¢ | $293 |
| GPT-6 Luna (Medium) | 336 | ✅ ✅ ✅ | 75 s | 0.30¢ | $3.00 |
_\* LLM costs are estimates based on token usage._
Realistically, developers probably won't be using a powerhouse model like Astra to transcribe documents at scale because of cost and latency. And document AI systems would make direct API calls instead of using coding harnesses like in this experiment. But this experiment was useful demonstration of how well a few general purpose models stack up against Datalab's model.
Okay, so what's with the accuracy bump to 100% for the Datalab model? Let's cover that next.
## Does the input format change the result?
When running the comparisons between models and providers I was surprised to see the Datalab model consistently returning the ground-truth value of 5.05 for the July 1950 scanned value, despite consistently returning 0.05 previously. Digging into this I found that the likely cause for this is using a PNG image as input for the head-to-head analysis, instead of the PDF used in the original analysis covering tabular data.
The table below compares the results for the PDF and PNG inputs.
| Input (Datalab balanced) | Cells correct (of 360, over 3 runs) | Read July 1950 correctly as 5.05? | Confidence for July 1950 | Flagged for review at 0.9? |
| ---------------------------- | ----------------------------------- | --------------------------------- | ------------------------ | -------------------------- |
| PDF page (683 × 1,106 px) | 357 | ❌ ❌ ❌ (read 0.05 every run) | 0.962–0.966 | ❌ |
| PNG image (1,483 × 2,401 px) | 360 | ✅ ✅ ✅ | 0.868–0.879 | ✅ |
This is not to say that you should always use image files instead of PDFs when converting documents. The takeaway here is that it's worth evaluating the OCR performance of different input formats when you have the option.
## Conclusion
General-purpose LLMs like Claude, GPT, and Gemini models are capable of OCR, but do not return confidence scores that we can use to flag uncertain values. The Datalab Convert API is capable of returning confidence scores and bounding boxes to indicate the location for each score. This functionality is available for text, tabular data, and list objects. These tools add a layer of protection against OCR hallucinations by enabling faster detection of uncertain values, enabling teams to route selected values that need to be reviewed manually.
## Frequently Asked Questions
### What are OCR hallucinations, and why do they happen?
OCR hallucinations are fabricated values that do not exist in the document being processed. Hallucinations are common to transformer models because they are trained to predict the next token in a sequence. For example, this model behavior may result in correcting the source data if there is a misspelling, because the model returns the spelling that it believes to be correct. In other cases, OCR hallucinations may cause information to be omitted when the input is degraded, such as a blurry image or faded ink.
### How can you reduce hallucinations when converting handwriting or scanned documents?
Use the best input quality possible when you have input options available. When an input is not suitable for OCR, request a re-scan or new image when that's an option. Choose an OCR model with additional safeguards against hallucinations, such as confidence scores and bounding boxes for each word or value. Write and maintain evaluations to check model performance and detect inaccuracies. Route the document to a human for review when the model is uncertain or the input is degraded.
### Why does AI guess instead of admitting it can't read a document?
A transformer model is trained to produce the most plausible continuation of a sequence. So the default behavior of certain models may result in guessing rather than admitting they cannot read the input. Transformer models may be capable of abstaining from making a prediction when specifically trained or prompted to do so, or when model providers build in internal verification processes that "heal" inputs, as Datalab describes [in this article on improving OCR accuracy](/blog/high-accuracy-update).
_The rotated cover title comes back as straight headings, the three lists as three HTML lists (23 items), and the building, seals and map as extracted images. Local browser screenshot of rendered HTML from the Datalab OCR model. Not a Datalab Playground screenshot._
## How do general-purpose LLMs compare to the Datalab Convert API?
Throughout this post we've seen that bounding boxes and confidence scores are useful for flagging uncertain values in converted documents. But how well do general-purpose LLMs perform on OCR conversion? General-purpose LLMs won't return word bounding boxes and confidence scores by default, so we won't be able to flag and review uncertain values like we do with the Datalab Convert API.
I wanted to compare how the Datalab Convert API stacks up against Claude, Gemini, and GPT models. Claude Code CLI and Codex CLI are the two harnesses I use daily for coding, so I set up an experiment to compare a couple models from each provider. As for Gemini, I used the Antigravity CLI harness which isn't one of my daily drivers, but I often use Gemini Flash models for vision tasks.
For each of Anthropic and OpenAI, I selected one "workhorse" model and one frontier model to compare against the Datalab Convert API in "balanced" and "accurate" mode ([accurate mode](/blog/high-accuracy-update) is used for the hardest OCR conversion cases). For Gemini, I only went with Gemini 3.6 Flash, the latest version of the model I have access to.
Here are the models I compared to Datalab:
- Claude Sonnet 5
- Claude Opus 5.5
- GPT-6 Luna
- GPT-6 Astra
- Gemini 3.6 Flash
This is not a formal evaluation. It's more like a vibe check, or an initial investigation into how well general-purpose LLMs perform on OCR conversion. The results here could be useful for deciding which providers and models would be worth coding up an API script for making direct calls to the model API, instead of running the OCR conversion through a coding harness. First up, we'll look at the results for each model without tool calls, like zooming and cropping. Think of it roughly like how well a model can transcribe values through OCR alone.
**Without tool calls**
| System (reasoning effort or mode) | Cells correct (of 360, over 3 runs) | Read the faint July 1950 value correctly as 5.05? | Median latency | Cost per page* | Cost per 1,000 pages* |
| --------------------------------- | ----------------------------------- | ------------------------------------------------- | -------------- | -------------- | --------------------- |
| Datalab (balanced) | 360 | ✅ ✅ ✅ | 24 s | 0.4¢ | $4 |
| Datalab (accurate) | 360 | ✅ ✅ ✅ | 33 s | 1.0¢ | $10 |
| Claude Opus 5.5 (Medium) | 354 | ❌ ❌ ❌ (read 6.05 every run) | 24 s | 7.5¢ | $75 |
| GPT-6 Astra (Medium) | 353 | ❌ ❌ ✅ (read 0.05 twice) | 87 s | 19.7¢ | $197 |
| Claude Sonnet 5 (High) | 351 | ✅ ✅ ✅ | 51 s | 8.5¢ | $85 |
| Gemini 3.6 Flash (High) | 350 | ✅ ✅ ❌ (read 0.05 once) | 34 s | 13.2¢ | $132 |
| GPT-6 Luna (Medium) | 340 | ✅ ✅ ✅ | 50 s | 0.16¢ | $1.60 |
_\* LLM costs are estimates based on token usage. Datalab costs are the published Convert rates. Word, table-cell, and list bounding boxes with confidence scores add $3–$9 per 1,000 pages._
Interestingly, the July 1950 value of 5.05 inches of precipitation caused problems for other models as well. Claude Opus consistently read the value as 6.05, while GPT-6 Astra read it as 0.05 two of three times. Notice that Astra and Gemini answers varied between runs, despite using the same image and prompt, while Datalab returned the same values every time.
Here's where the surprise came. For both the balanced and accurate modes, the Datalab model read the value correctly every time despite reading the value incorrectly as 0.05 earlier. I'll explain why later in the post. For now, take a look at the quality, latency, and cost for each model we tested.
The Datalab Convert API returned the highest accuracy in both balanced and accurate mode, and at costs lower than all other models except for GPT-6 Luna. But Luna had the lowest overall accuracy of all models and consistently returned the most misread values.
After seeing these results I was curious if tool use, like cropping and zooming, improves OCR conversion performance for general-purpose LLMs, so we'll look at that next.
## Does tool calling improve OCR conversion and reduce hallucinations for general-purpose LLMs?
When allowing tool calls, like cropping and zooming, the general-purpose LLMs would generally prefer to use them over native OCR alone. This is where model behavior differs from model to model.
Most fascinating to me was that despite being more expensive per token, Opus 5.5 ended up being cheaper and faster than Sonnet 5 because Sonnet went heavy on the tool use. Really heavy. Opus would sometimes cut the image into a few bands but then quickly return its analysis. Sonnet on the other hand made heavy use of image processing tools like cropping, zooming, and finding table grid lines, often making dozens of tool calls per run.
Astra and Gemini Flash consistently used cropping and zooming techniques during their analysis, whereas Luna generally made very few tool calls.
**With tool calls**
| System (reasoning effort) | Cells correct (of 360, over 3 runs) | Read the faint July 1950 value correctly as 5.05? | Median latency | Cost per page* | Cost per 1,000 pages* |
| ------------------------- | ----------------------------------- | ------------------------------------------------- | -------------- | -------------- | --------------------- |
| Claude Opus 5.5 (Medium) | 358 | ✅ ✅ ✅ | 48 s | 34¢ | $340 |
| Claude Sonnet 5 (High) | 356 | ✅ ✅ ✅ | 608 s (10 min) | $2.47 | $2,467 |
| GPT-6 Astra (Medium) | 352 | ❌ ❌ ❌ (read 0.05 every run) | 148 s | 62¢ | $623 |
| Gemini 3.6 Flash (High) | 352 | ✅ ✅ ✅ | 258 s | 29.3¢ | $293 |
| GPT-6 Luna (Medium) | 336 | ✅ ✅ ✅ | 75 s | 0.30¢ | $3.00 |
_\* LLM costs are estimates based on token usage._
Realistically, developers probably won't be using a powerhouse model like Astra to transcribe documents at scale because of cost and latency. And document AI systems would make direct API calls instead of using coding harnesses like in this experiment. But this experiment was useful demonstration of how well a few general purpose models stack up against Datalab's model.
Okay, so what's with the accuracy bump to 100% for the Datalab model? Let's cover that next.
## Does the input format change the result?
When running the comparisons between models and providers I was surprised to see the Datalab model consistently returning the ground-truth value of 5.05 for the July 1950 scanned value, despite consistently returning 0.05 previously. Digging into this I found that the likely cause for this is using a PNG image as input for the head-to-head analysis, instead of the PDF used in the original analysis covering tabular data.
The table below compares the results for the PDF and PNG inputs.
| Input (Datalab balanced) | Cells correct (of 360, over 3 runs) | Read July 1950 correctly as 5.05? | Confidence for July 1950 | Flagged for review at 0.9? |
| ---------------------------- | ----------------------------------- | --------------------------------- | ------------------------ | -------------------------- |
| PDF page (683 × 1,106 px) | 357 | ❌ ❌ ❌ (read 0.05 every run) | 0.962–0.966 | ❌ |
| PNG image (1,483 × 2,401 px) | 360 | ✅ ✅ ✅ | 0.868–0.879 | ✅ |
This is not to say that you should always use image files instead of PDFs when converting documents. The takeaway here is that it's worth evaluating the OCR performance of different input formats when you have the option.
## Conclusion
General-purpose LLMs like Claude, GPT, and Gemini models are capable of OCR, but do not return confidence scores that we can use to flag uncertain values. The Datalab Convert API is capable of returning confidence scores and bounding boxes to indicate the location for each score. This functionality is available for text, tabular data, and list objects. These tools add a layer of protection against OCR hallucinations by enabling faster detection of uncertain values, enabling teams to route selected values that need to be reviewed manually.
## Frequently Asked Questions
### What are OCR hallucinations, and why do they happen?
OCR hallucinations are fabricated values that do not exist in the document being processed. Hallucinations are common to transformer models because they are trained to predict the next token in a sequence. For example, this model behavior may result in correcting the source data if there is a misspelling, because the model returns the spelling that it believes to be correct. In other cases, OCR hallucinations may cause information to be omitted when the input is degraded, such as a blurry image or faded ink.
### How can you reduce hallucinations when converting handwriting or scanned documents?
Use the best input quality possible when you have input options available. When an input is not suitable for OCR, request a re-scan or new image when that's an option. Choose an OCR model with additional safeguards against hallucinations, such as confidence scores and bounding boxes for each word or value. Write and maintain evaluations to check model performance and detect inaccuracies. Route the document to a human for review when the model is uncertain or the input is degraded.
### Why does AI guess instead of admitting it can't read a document?
A transformer model is trained to produce the most plausible continuation of a sequence. So the default behavior of certain models may result in guessing rather than admitting they cannot read the input. Transformer models may be capable of abstaining from making a prediction when specifically trained or prompted to do so, or when model providers build in internal verification processes that "heal" inputs, as Datalab describes [in this article on improving OCR accuracy](/blog/high-accuracy-update).
 [Casey Bates](https://www.linkedin.com/in/caseybates/) is the founder and CTO of ThinkFox AI, where he builds agentic AI tools and teaches teams to use them.