 Talk to Sales
 Benchmarks
View scores and output across OCR models spanning many document categories.
Want to run these evals on your own documents?
Talk to Sales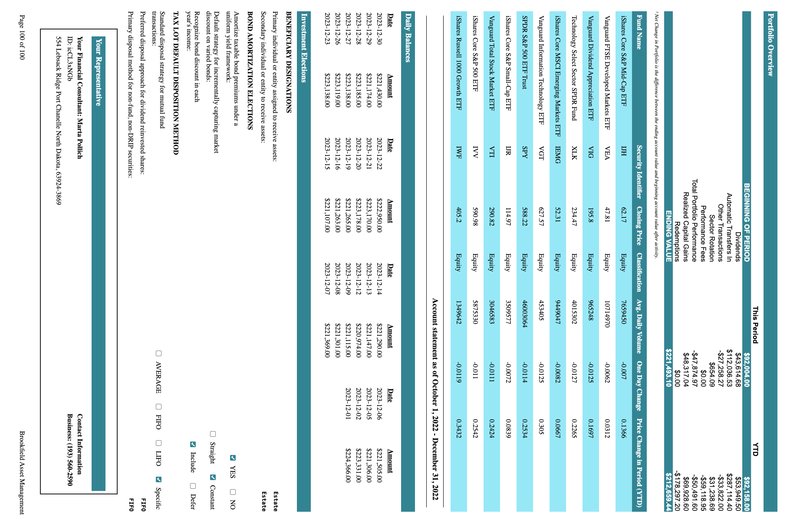
Portfolio Overview
| BEGINNING OF PERIOD | This Period | YTD | |
|---|---|---|---|
| Dividends | $92,004.00 | $92,158.00 | |
| Automatic Transfers In | $43,614.68 | $53,949.50 | |
| Other Transactions | $112,036.53 | $287,114.40 | |
| Sector Rotation | -$27,258.27 | -$33,822.00 | |
| Performance Fees | $654.09 | $31,238.69 | |
| Total Portfolio Performance | $0.00 | -$59,118.95 | |
| Realized Capital Gains | -$47,874.97 | -$50,491.60 | |
| Redemptions | $48,317.04 | $69,928.60 | |
| $0.00 | -$178,297.20 | ||
| ENDING VALUE | $221,493.10 | $212,659.44 |
1 Net Change in Portfolio is the difference between the ending account value and beginning account value after activity.
| Fund Name | Security Identifier | Closing Price | Classification | Avg. Daily Volume | One Day Change | Price Change in Period (YTD) |
|---|---|---|---|---|---|---|
| iShares Core S&P Mid-Cap ETF | IJH | 62.17 | Equity | 7659450 | -0.007 | 0.1366 |
| Vanguard FTSE Developed Markets ETF | VEA | 47.81 | Equity | 10714970 | -0.0062 | 0.0312 |
| Vanguard Dividend Appreciation ETF | VIG | 195.8 | Equity | 965248 | -0.0125 | 0.1697 |
| Technology Select Sector SPDR Fund | XLK | 234.47 | Equity | 4015302 | -0.0127 | 0.2265 |
| iShares Core MSCI Emerging Markets ETF | IEMG | 52.31 | Equity | 9449047 | -0.0082 | 0.0667 |
| Vanguard Information Technology ETF | VGT | 627.57 | Equity | 453405 | -0.0125 | 0.305 |
| SPDR S&P 500 ETF Trust | SPY | 588.22 | Equity | 46003064 | -0.0114 | 0.2534 |
| iShares Core S&P Small-Cap ETF | IJR | 114.97 | Equity | 3509577 | -0.0072 | 0.0839 |
| Vanguard Total Stock Market ETF | VTI | 290.82 | Equity | 3046583 | -0.0111 | 0.2424 |
| iShares Core S&P 500 ETF | IVV | 590.98 | Equity | 5875330 | -0.011 | 0.2542 |
| iShares Russell 1000 Growth ETF | IWF | 405.2 | Equity | 1349642 | -0.0119 | 0.3432 |
Account statement as of October 1, 2022 - December 31, 2022
Daily Balances
| Date | Amount | Date | Amount | Date | Amount | Date | Amount |
|---|---|---|---|---|---|---|---|
| 2023-12-30 | $221,430.00 | 2023-12-22 | $222,950.00 | 2023-12-14 | $221,290.00 | 2023-12-06 | $221,505.00 |
| 2023-12-29 | $221,174.00 | 2023-12-21 | $223,170.00 | 2023-12-13 | $221,147.00 | 2023-12-05 | $221,306.00 |
| 2023-12-28 | $223,185.00 | 2023-12-20 | $223,178.00 | 2023-12-12 | $220,974.00 | 2023-12-02 | $223,331.00 |
| 2023-12-27 | $223,138.00 | 2023-12-19 | $221,265.00 | 2023-12-09 | $221,115.00 | 2023-12-01 | $224,366.00 |
| 2023-12-26 | $223,119.00 | 2023-12-16 | $221,263.00 | 2023-12-08 | $221,301.00 | ||
| 2023-12-23 | $223,138.00 | 2023-12-15 | $221,107.00 | 2023-12-07 | $221,369.00 |
Investment Elections
BENEFICIARY DESIGNATIONS
Primary individual or entity assigned to receive assets:
Secondary individual or entity to receive assets:
BOND AMORTIZATION ELECTIONS
Amortize taxable bond premiums under a uniform yield framework:
Default strategy for incrementally capturing market discount on varied bonds:
Recognize bond discount in each year's income:
TAX LOT DEFAULT DISPOSITION METHOD
Standard disposal strategy for mutual fund transactions:
Preferred disposal approach for dividend reinvested shares:
Primary disposal method for non-fund, non-DRIP securities:
Your Representative
Your Financial Consultant: Marta Pollich
ID: icCL3xNGb
554 Lebsack Ridge Port Chanelle North Dakota, 63924-3869
Contact Information
Business: (193) 560-2590
YES
NO
Straight
Constant
Include
Defer
Estate
Estate
AVERAGE
FIFO
LIFO
Specific
FIFO
FIFO
Page 100 of 100
Brookfield Asset Management