 Talk to Sales
 Benchmarks
View scores and output across OCR models spanning many document categories.
Want to run these evals on your own documents?
Talk to Sales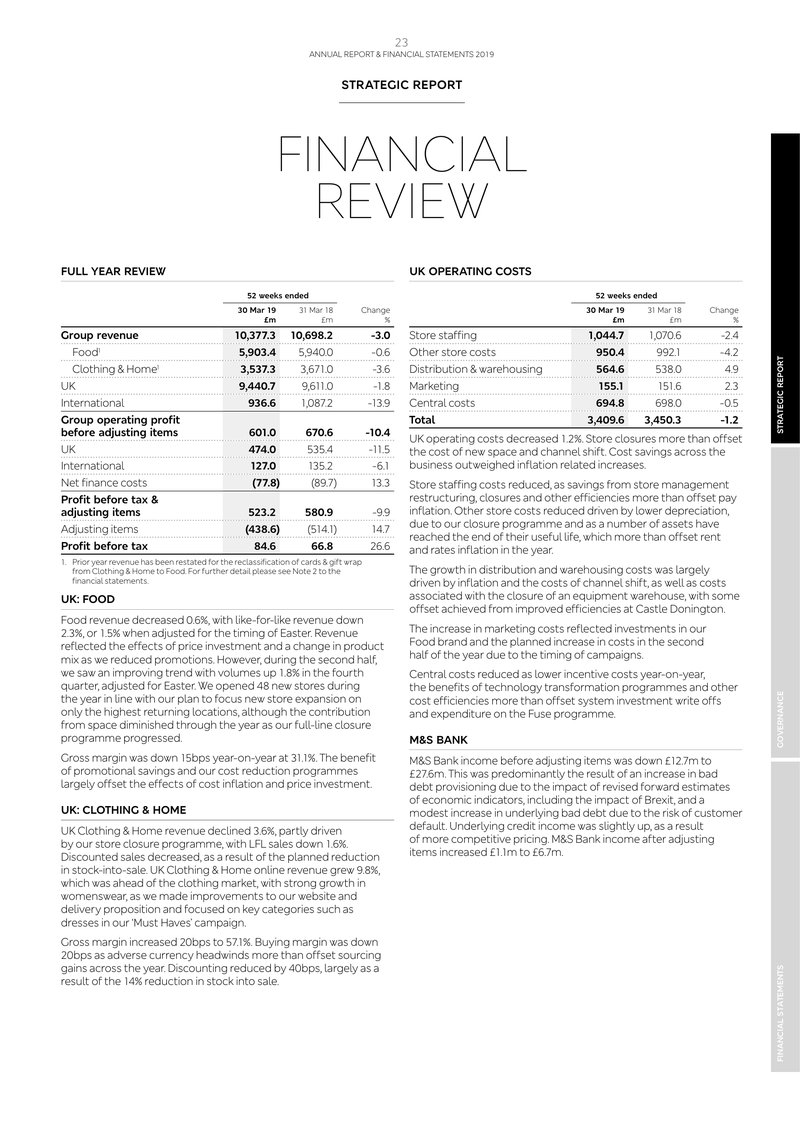
ANNUAL REPORT & FINANCIAL STATEMENTS 2019
STRATEGIC REPORT
FINANCIAL
REVIEW
FULL YEAR REVIEW
| 52 weeks ended | |||
|---|---|---|---|
|
30 Mar 19
£m |
31 Mar 18
£m |
Change
% |
|
| Group revenue | 10,377.3 | 10,698.2 | -3.0 |
| Food 1 | 5,903.4 | 5,940.0 | -0.6 |
| Clothing & Home 1 | 3,537.3 | 3,671.0 | -3.6 |
| UK | 9,440.7 | 9,611.0 | -1.8 |
| International | 936.6 | 1,087.2 | -13.9 |
| Group operating profit before adjusting items | 601.0 | 670.6 | -10.4 |
| UK | 474.0 | 535.4 | -11.5 |
| International | 127.0 | 135.2 | -6.1 |
| Net finance costs | (77.8) | (89.7) | 13.3 |
| Profit before tax & adjusting items | 523.2 | 580.9 | -9.9 |
| Adjusting items | (438.6) | (514.1) | 14.7 |
| Profit before tax | 84.6 | 66.8 | 26.6 |
1. Prior year revenue has been restated for the reclassification of cards & gift wrap from Clothing & Home to Food. For further detail please see Note 2 to the financial statements.
UK: FOOD
Food revenue decreased 0.6%, with like-for-like revenue down 2.3%, or 1.5% when adjusted for the timing of Easter. Revenue reflected the effects of price investment and a change in product mix as we reduced promotions. However, during the second half, we saw an improving trend with volumes up 1.8% in the fourth quarter, adjusted for Easter. We opened 48 new stores during the year in line with our plan to focus new store expansion on only the highest returning locations, although the contribution from space diminished through the year as our full-line closure programme progressed.
Gross margin was down 15bps year-on-year at 31.1%. The benefit of promotional savings and our cost reduction programmes largely offset the effects of cost inflation and price investment.
UK: CLOTHING & HOME
UK Clothing & Home revenue declined 3.6%, partly driven by our store closure programme, with LFL sales down 1.6%. Discounted sales decreased, as a result of the planned reduction in stock-into-sale. UK Clothing & Home online revenue grew 9.8%, which was ahead of the clothing market, with strong growth in womenswear, as we made improvements to our website and delivery proposition and focused on key categories such as dresses in our 'Must Haves' campaign.
Gross margin increased 20bps to 57.1%. Buying margin was down 20bps as adverse currency headwinds more than offset sourcing gains across the year. Discounting reduced by 40bps, largely as a result of the 14% reduction in stock into sale.
UK OPERATING COSTS
| 52 weeks ended | |||
|---|---|---|---|
|
30 Mar 19
£m |
31 Mar 18
£m |
Change
% |
|
| Store staffing | 1,044.7 | 1,070.6 | -2.4 |
| Other store costs | 950.4 | 992.1 | -4.2 |
| Distribution & warehousing | 564.6 | 538.0 | 4.9 |
| Marketing | 155.1 | 151.6 | 2.3 |
| Central costs | 694.8 | 698.0 | -0.5 |
| Total | 3,409.6 | 3,450.3 | -1.2 |
UK operating costs decreased 1.2%. Store closures more than offset the cost of new space and channel shift. Cost savings across the business outweighed inflation related increases.
Store staffing costs reduced, as savings from store management restructuring, closures and other efficiencies more than offset pay inflation. Other store costs reduced driven by lower depreciation, due to our closure programme and as a number of assets have reached the end of their useful life, which more than offset rent and rates inflation in the year.
The growth in distribution and warehousing costs was largely driven by inflation and the costs of channel shift, as well as costs associated with the closure of an equipment warehouse, with some offset achieved from improved efficiencies at Castle Donington.
The increase in marketing costs reflected investments in our Food brand and the planned increase in costs in the second half of the year due to the timing of campaigns.
Central costs reduced as lower incentive costs year-on-year, the benefits of technology transformation programmes and other cost efficiencies more than offset system investment write offs and expenditure on the Fuse programme.
M&S BANK
M&S Bank income before adjusting items was down £12.7m to £27.6m. This was predominantly the result of an increase in bad debt provisioning due to the impact of revised forward estimates of economic indicators, including the impact of Brexit, and a modest increase in underlying bad debt due to the risk of customer default. Underlying credit income was slightly up, as a result of more competitive pricing. M&S Bank income after adjusting items increased £1.1m to £6.7m.
STRATEGIC REPORT
GOVERNANCE
FINANCIAL STATEMENTS