 Talk to Sales
 Benchmarks
View scores and output across OCR models spanning many document categories.
Want to run these evals on your own documents?
Talk to Sales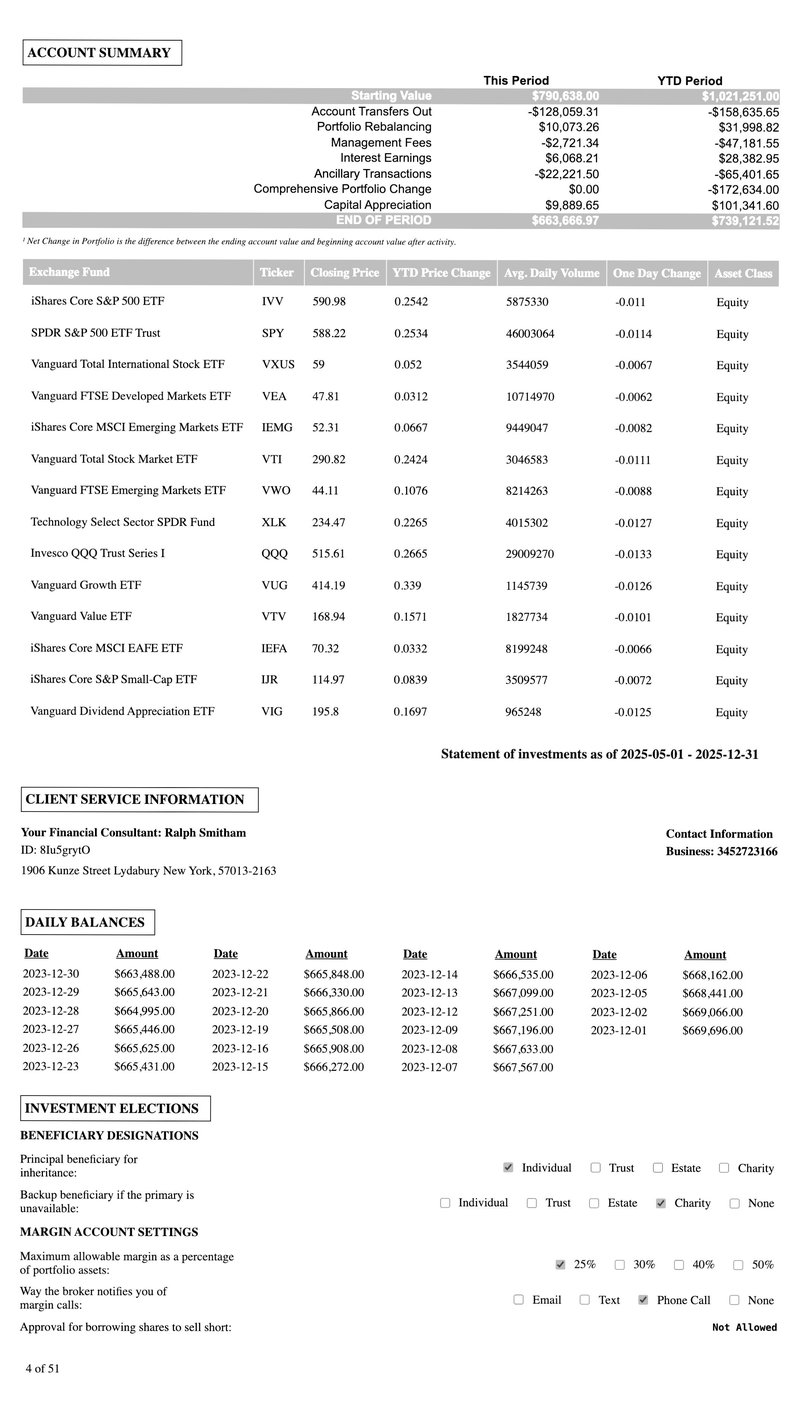
ACCOUNT SUMMARY
| This Period | YTD Period | |
|---|---|---|
| Starting Value | $790,638.00 | $1,021,251.00 |
| Account Transfers Out | -$128,059.31 | -$158,635.65 |
| Portfolio Rebalancing | $10,073.26 | $31,998.82 |
| Management Fees | -$2,721.34 | -$47,181.55 |
| Interest Earnings | $6,068.21 | $28,382.95 |
| Ancillary Transactions | -$22,221.50 | -$65,401.65 |
| Comprehensive Portfolio Change | $0.00 | -$172,634.00 |
| Capital Appreciation | $9,889.65 | $101,341.60 |
| END OF PERIOD | $663,666.97 | $739,121.52 |
1 Net Change in Portfolio is the difference between the ending account value and beginning account value after activity.
| Exchange Fund | Ticker | Closing Price | YTD Price Change | Avg. Daily Volume | One Day Change | Asset Class |
|---|---|---|---|---|---|---|
| iShares Core S&P 500 ETF | IVV | 590.98 | 0.2542 | 5875330 | -0.011 | Equity |
| SPDR S&P 500 ETF Trust | SPY | 588.22 | 0.2534 | 46003064 | -0.0114 | Equity |
| Vanguard Total International Stock ETF | VXUS | 59 | 0.052 | 3544059 | -0.0067 | Equity |
| Vanguard FTSE Developed Markets ETF | VEA | 47.81 | 0.0312 | 10714970 | -0.0062 | Equity |
| iShares Core MSCI Emerging Markets ETF | IEMG | 52.31 | 0.0667 | 9449047 | -0.0082 | Equity |
| Vanguard Total Stock Market ETF | VTI | 290.82 | 0.2424 | 3046583 | -0.0111 | Equity |
| Vanguard FTSE Emerging Markets ETF | VWO | 44.11 | 0.1076 | 8214263 | -0.0088 | Equity |
| Technology Select Sector SPDR Fund | XLK | 234.47 | 0.2265 | 4015302 | -0.0127 | Equity |
| Invesco QQQ Trust Series I | QQQ | 515.61 | 0.2665 | 29009270 | -0.0133 | Equity |
| Vanguard Growth ETF | VUG | 414.19 | 0.339 | 1145739 | -0.0126 | Equity |
| Vanguard Value ETF | VTV | 168.94 | 0.1571 | 1827734 | -0.0101 | Equity |
| iShares Core MSCI EAFE ETF | IEFA | 70.32 | 0.0332 | 8199248 | -0.0066 | Equity |
| iShares Core S&P Small-Cap ETF | IJR | 114.97 | 0.0839 | 3509577 | -0.0072 | Equity |
| Vanguard Dividend Appreciation ETF | VIG | 195.8 | 0.1697 | 965248 | -0.0125 | Equity |
Statement of investments as of 2025-05-01 - 2025-12-31
CLIENT SERVICE INFORMATION
Your Financial Consultant: Ralph Smitham
ID: 8Iu5grytO
1906 Kunze Street Lydabury New York, 57013-2163
Contact Information
Business: 3452723166
DAILY BALANCES
| Date | Amount | Date | Amount | Date | Amount | Date | Amount |
|---|---|---|---|---|---|---|---|
| 2023-12-30 | $663,488.00 | 2023-12-22 | $665,848.00 | 2023-12-14 | $666,535.00 | 2023-12-06 | $668,162.00 |
| 2023-12-29 | $665,643.00 | 2023-12-21 | $666,330.00 | 2023-12-13 | $667,099.00 | 2023-12-05 | $668,441.00 |
| 2023-12-28 | $664,995.00 | 2023-12-20 | $665,866.00 | 2023-12-12 | $667,251.00 | 2023-12-02 | $669,066.00 |
| 2023-12-27 | $665,446.00 | 2023-12-19 | $665,508.00 | 2023-12-09 | $667,196.00 | 2023-12-01 | $669,696.00 |
| 2023-12-26 | $665,625.00 | 2023-12-16 | $665,908.00 | 2023-12-08 | $667,633.00 | ||
| 2023-12-23 | $665,431.00 | 2023-12-15 | $666,272.00 | 2023-12-07 | $667,567.00 |
INVESTMENT ELECTIONS
BENEFICIARY DESIGNATIONS
Principal beneficiary for inheritance:
Individual Trust Estate Charity
Backup beneficiary if the primary is unavailable:
Individual Trust Estate Charity None
MARGIN ACCOUNT SETTINGS
Maximum allowable margin as a percentage of portfolio assets:
25% 30% 40% 50%
Way the broker notifies you of margin calls:
Email Text Phone Call None
Approval for borrowing shares to sell short:
Not Allowed
4 of 51