 Talk to Sales
 Benchmarks
View scores and output across OCR models spanning many document categories.
Want to run these evals on your own documents?
Talk to Sales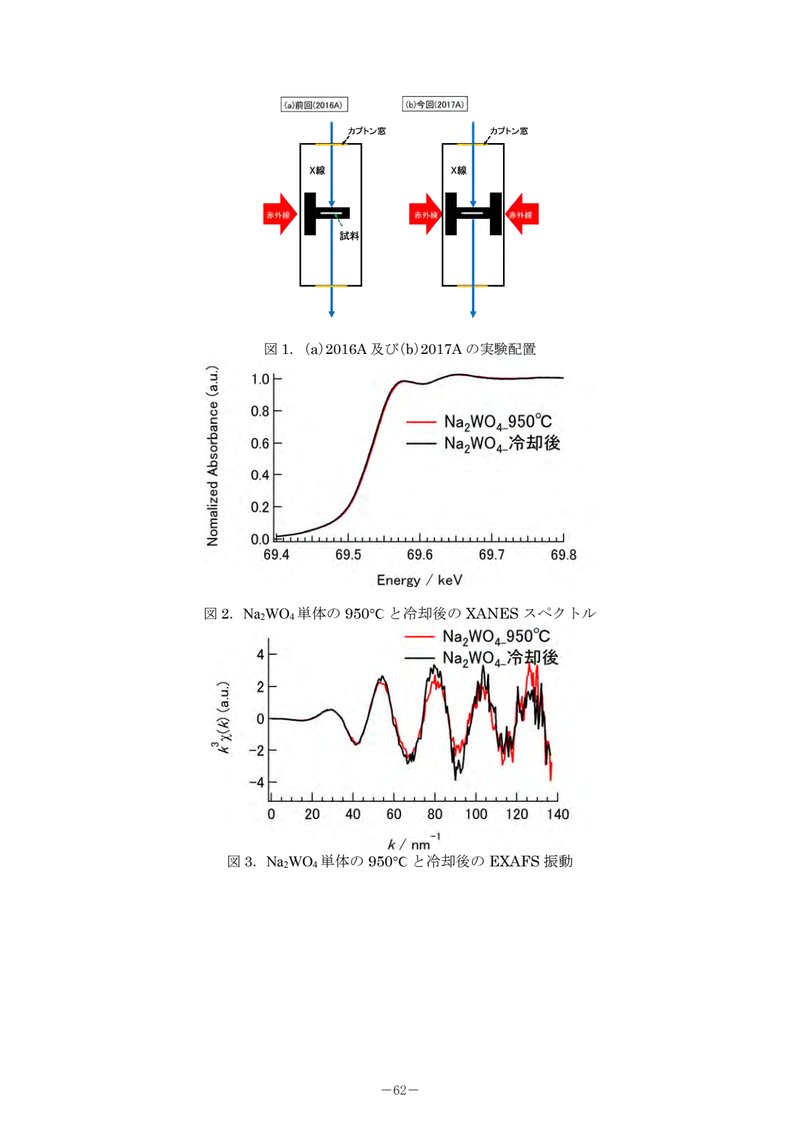

Figure 1 illustrates the experimental setup for X-ray absorption spectroscopy (XAS) measurements. Both configurations show X-rays (X線) passing vertically through the sample (試料). A Kapton window (カプトン窓) is used.
(a) Previous setup (2016A): Infrared light (赤外線) is incident from the left.
(b) Current setup (2017A): Infrared light (赤外線) is incident from both the left and the right.
図1. (a) 2016A 及び (b) 2017A の実験配置

Figure 2 displays the XANES spectra for . The Y-axis represents Normalized Absorbance (a.u.) and the X-axis represents Energy / keV. The red line represents at , and the black line represents after cooling (冷却後). The spectra show the absorption edge around 69.5 keV.
図2. 単体の と冷却後の XANES スペクトル

Figure 3 displays the EXAFS oscillations for . The Y-axis represents (a.u.) and the X-axis represents . The red line represents at , and the black line represents after cooling (冷却後). The oscillations show differences between the high-temperature and cooled states, indicating changes in the local structure.
図3. 単体の と冷却後の EXAFS 振動
-62-