 Talk to Sales
 Benchmarks
View scores and output across OCR models spanning many document categories.
Want to run these evals on your own documents?
Talk to Sales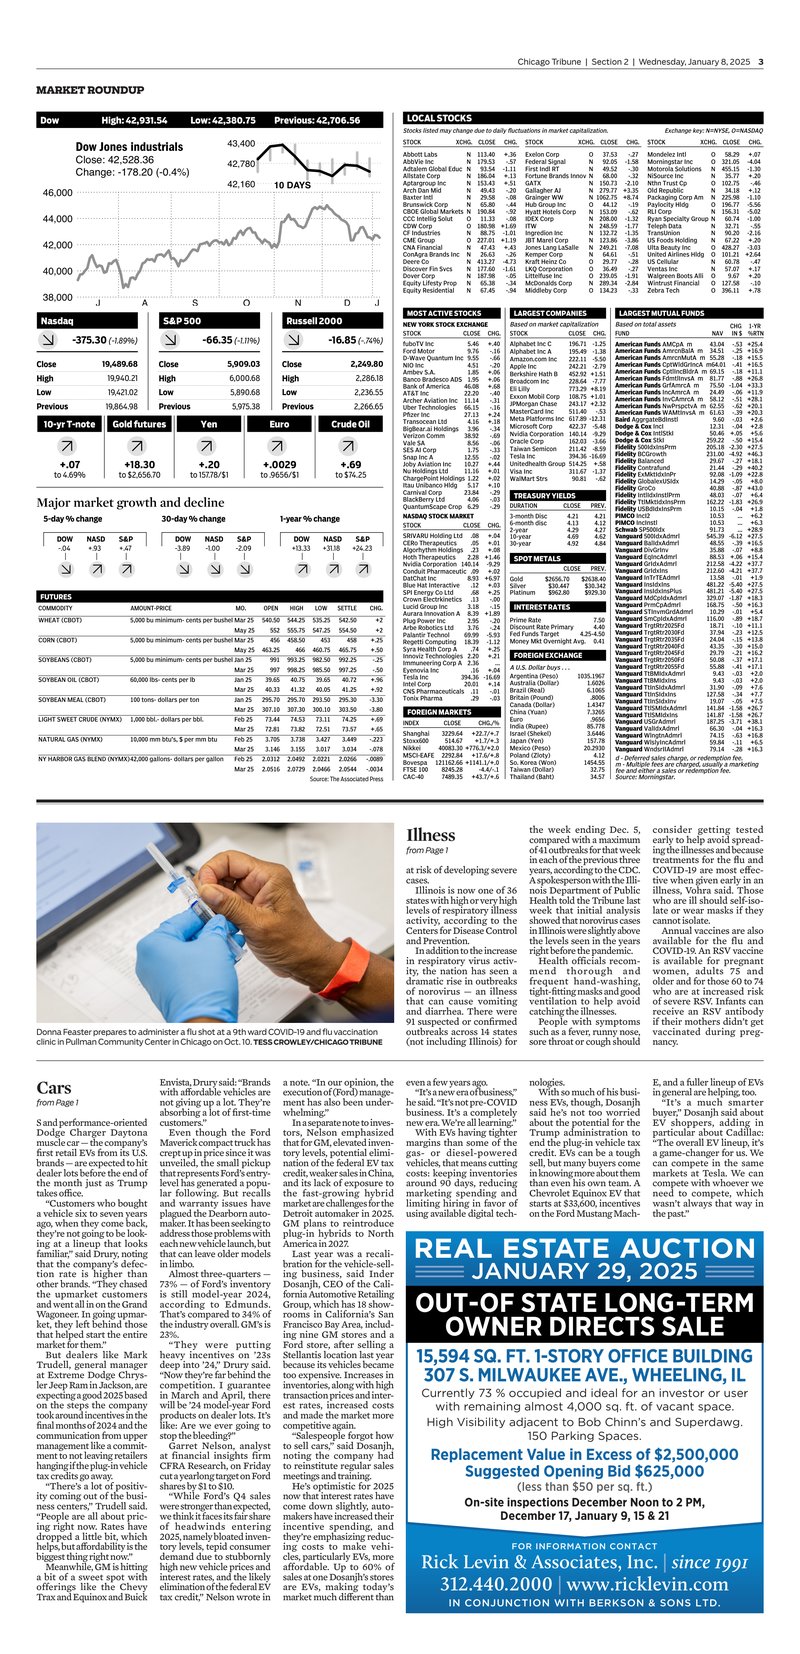
Chicago Tribune | Section 2 | Wednesday, January 8, 2025 3
MARKET ROUNDUP
Dow High: 42,931.54 Low: 42,380.75 Previous: 42,706.56
Dow Jones industrials
Close: 42,528.36
Change: -178.20 (-0.4%)

Nasdaq
-375.30 (-1.89%)
Close 19,489.68
High 19,940.21
Low 19,421.02
Previous 19,864.98
S&P 500
-66.35 (-1.11%)
Close 5,909.03
High 6,000.68
Low 5,890.68
Previous 5,975.38
Russell 2000
-16.85 (-.74%)
Close 2,249.80
High 2,286.18
Low 2,236.55
Previous 2,266.65
10-yr T-note
+0.07
to 4.69%
Gold futures
+18.30
to $2,656.70
Yen
+0.20
to 157.78/$1
Euro
+0.0029
to 0.9656/$1
Crude Oil
+0.69
to $74.25
Major market growth and decline
5-day % change
| DOW | NASD | S&P |
|---|---|---|
| -0.4 | +0.93 | +0.47 |
30-day % change
| DOW | NASD | S&P |
|---|---|---|
| -3.89 | -1.00 | -2.09 |
1-year % change
| DOW | NASD | S&P |
|---|---|---|
| +13.33 | +31.18 | +24.23 |
FUTURES
| COMMODITY | AMOUNT-PRICE | MO. | OPEN | HIGH | LOW | SETTLE | CHG. |
|---|---|---|---|---|---|---|---|
| WHEAT (CBOT) | 5,000 bu minimum- cents per bushel | Mar 25 | 540.50 | 544.25 | 535.25 | 542.50 | +2 |
| May 25 | 552.50 | 555.75 | 547.25 | 554.50 | +2 | ||
| CORN (CBOT) | 5,000 bu minimum- cents per bushel | Mar 25 | 456 | 458.50 | 453 | 458 | +2.25 |
| May 25 | 463.25 | 466 | 460.75 | 465 | +0.50 | ||
| SOYBEANS (CBOT) | 5,000 bu minimum- cents per bushel | Jan 25 | 991 | 993.25 | 985.50 | 992.25 | -2.25 |
| Mar 25 | 987 | 988.25 | 985.50 | 987.25 | -0.50 | ||
| SOYBEAN OIL (CBOT) | 60,000 lbs- cents per lb | Jan 25 | 39.65 | 40.75 | 39.65 | 40.72 | +0.96 |
| Mar 25 | 40.05 | 40.95 | 39.95 | 40.82 | +0.92 | ||
| SOYBEAN MEAL (CBOT) | 100 tons- dollars per ton | Jan 25 | 295.70 | 295.70 | 293.50 | 295.30 | -3.30 |
| Mar 25 | 301.30 | 302.10 | 300.00 | 301.30 | -0.80 | ||
| LIGHT SWEET CRUDE (NYMEX) | 1,000 bbl- dollars per bbl. | Feb 25 | 73.44 | 74.53 | 73.11 | 74.25 | +0.69 |
| Mar 25 | 72.81 | 73.82 | 72.51 | 73.57 | +0.65 | ||
| NATURAL GAS (NYMEX) | 10,000 mm btu's, $ per mm btu | Feb 25 | 3.705 | 3.738 | 3.427 | 3.449 | -.223 |
| Mar 25 | 3.146 | 3.155 | 3.017 | 3.034 | -.078 | ||
| NY HARBOR GAS BLEND (NYMEX) | 42,000 gallons- dollars per gallon | Feb 25 | 2.0312 | 2.0492 | 2.0221 | 2.0266 | -0.0089 |
| Mar 25 | 2.0516 | 2.0729 | 2.0466 | 2.0544 | -0.0034 |
Source: The Associated Press

Donna Feaster prepares to administer a flu shot at a 9th ward COVID-19 and flu vaccination clinic in Pullman Community Center in Chicago on Oct. 10. TESS CROWLEY/CHICAGO TRIBUNE
Cars
from Page 1
S and performance-oriented Dodge Charger Daytona muscle car — the company's first retail EVs from its U.S. brands — are expected to hit dealer lots before the end of the month just as Trump takes office.
"Customers who bought a vehicle six to seven years ago, when they come back, they're not going to be looking at a lineup that looks familiar," said Drury, noting that the company's defection rate is higher than other brands. "They chased the upmarket customers and went all in on the Grand Wagoneer. In going upmarket, they left behind those that helped start the entire market for them."
But dealers like Mark Trudell, general manager at Extreme Dodge Chrysler Jeep Ram in Jackson, are expecting a good 2025 based on the steps the company took around incentives in the final months of 2024 and the communication from upper management like a commitment to not leaving retailers hanging if the plug-in vehicle tax credits go away.
"There's a lot of positivity coming out of the business centers," Trudell said. "People are all about pricing right now. Rates have dropped a little bit, which helps, but affordability is the biggest thing right now."
Meanwhile, GM is hitting a bit of a sweet spot with offerings like the Chevy Trax and Equinox and Buick
Envista, Drury said: "Brands with affordable vehicles are not giving up a lot. They're absorbing a lot of first-time customers."
Even though the Ford Maverick compact truck has crept up in price since it was unveiled, the small pickup that represents Ford's entry-level has generated a popular following. But recalls and warranty issues have plagued the Dearborn automaker. It has been seeking to address those problems with each new vehicle launch, but that can leave older models in limbo.
Almost three-quarters — 73% — of Ford's inventory is still model-year 2024, according to Edmunds. That's compared to 34% of the industry overall. GM's is 23%.
"They were putting heavy incentives on '23s deep into '24," Drury said. "Now they're far behind the competition. I guarantee in March and April, there will be '24 model-year Ford products on dealer lots. It's like: Are we ever going to stop the bleeding?"
Garrett Nelson, analyst at financial insights firm CFRA Research, on Friday cut a yearlong target on Ford shares by $1 to $10.
"While Ford's Q4 sales were stronger than expected, we think it faces its fair share of headwinds entering 2025, namely bloated inventory levels, tepid consumer demand due to stubbornly high new vehicle prices and interest rates, and the likely elimination of the federal EV tax credit," Nelson wrote in
a note. "In our opinion, the execution of (Ford) management has also been underwhelming."
In a separate note to investors, Nelson emphasized that for GM, elevated inventory levels, potential elimination of the federal EV tax credit, weaker sales in China, and its lack of exposure to the fast-growing hybrid market are challenges for the Detroit automaker in 2025. GM plans to reintroduce plug-in hybrids to North America in 2027.
Last year was a recalibration for the vehicle-selling business, said Inder Dosanjh, CEO of the California Automotive Retailing Group, which has 18 showrooms in California's San Francisco Bay Area, including nine GM stores and a Ford store, after selling a Stellantis location last year because its vehicles became too expensive. Increases in inventories, along with high transaction prices and interest rates, increased costs and made the market more competitive again.
"Salespeople forgot how to sell cars," said Dosanjh, noting the company had to reinstitute regular sales meetings and training.
He's optimistic for 2025 now that interest rates have come down slightly, automakers have increased their incentive spending, and they're emphasizing reducing costs to make vehicles, particularly EVs, more affordable. Up to 60% of sales at one Dosanjh's stores are EVs, making today's market much different than
even a few years ago.
"It's a new era of business," he said. "It's not pre-COVID business. It's a completely new era. We're all learning."
With EVs having tighter margins than some of the gas- or diesel-powered vehicles, that means cutting costs: keeping inventories around 90 days, reducing marketing spending and limiting hiring in favor of using available digital tech-
nologies.
With so much of his business EVs, though, Dosanjh said he's not too worried about the potential for the Trump administration to end the plug-in vehicle tax credit. EVs can be a tough sell, but many buyers come in knowing more about them than even his own team. A Chevrolet Equinox EV that starts at $33,600, incentives on the Ford Mustang Mach-
E, and a fuller lineup of EVs in general are helping, too.
"It's a much smarter buyer," Dosanjh said about EV shoppers, adding in particular about Cadillac: "The overall EV lineup, it's a game-changer for us. We can compete in the same markets as Tesla. We can compete with whoever we need to compete, which wasn't always that way in the past."
Illness
from Page 1
at risk of developing severe cases.
Illinois is now one of 36 states with high or very high levels of respiratory illness activity, according to the Centers for Disease Control and Prevention. In addition to the increase in respiratory virus activity, the nation has seen a dramatic rise in outbreaks of norovirus — an illness that can cause vomiting and diarrhea. There were 91 suspected or confirmed outbreaks across 14 states (not including Illinois) for the week ending Dec. 5, compared with a maximum of 41 outbreaks for that week in each of the previous three years, according to the CDC. A spokesperson with the Illinois Department of Public Health told the Tribune last week that initial analysis showed that norovirus cases in Illinois were slightly above the levels seen in the years right before the pandemic.
Health officials recommend thorough and frequent hand-washing, tight-fitting masks and good ventilation to help avoid catching the illnesses. People with symptoms such as a fever, runny nose, sore throat or cough should consider getting tested early to help avoid spreading the illnesses and because treatments for the flu and COVID-19 are most effective when given early in an illness. Vohra said those who are ill should self-isolate or wear masks if they cannot isolate. Annual vaccines are also available for the flu and COVID-19. An RSV vaccine is available for pregnant women, adults 75 and older and for those 60 to 74 who are at increased risk of severe RSV. Infants can receive an RSV antibody if their mothers didn't get vaccinated during pregnancy.
REAL ESTATE AUCTION
JANUARY 29, 2025
OUT-OF-STATE LONG-TERM OWNER DIRECTS SALE
15,594 SQ. FT. 1-STORY OFFICE BUILDING
307 S. MILWAUKEE AVE., WHEELING, IL
Currently 73 % occupied and ideal for an investor or user with remaining almost 4,000 sq. ft. of vacant space. High Visibility adjacent to Bob Chinn's and Superdawg. 150 Parking Spaces.
Replacement Value in Excess of $2,500,000
Suggested Opening Bid $625,000
(less than $50 per sq. ft.)
On-site inspections
December Noon to 2 PM,
December 17, January 9, 15 & 21
FOR INFORMATION CONTACT
Rick Levin & Associates, Inc. | since 1991
312.440.2000 | www.ricklevin.com
IN CONJUNCTION WITH BERKSON & SONS LTD.
LOCAL STOCKS
Stocks listed may change due to daily fluctuations in market capitalization.
Exchange key: N=NYSE, O=NASDAQ
| STOCK | XCHG. | CLOSE | CHG. | STOCK | XCHG. | CLOSE | CHG. | STOCK | XCHG. | CLOSE | CHG. |
|---|---|---|---|---|---|---|---|---|---|---|---|
| Abbott Labs | N | 113.40 | +3.6 | Exelon Corp | O | 37.53 | -2.7 | Mondelez Intl | O | 58.29 | +0.7 |
| AbbVie Inc | N | 179.53 | -5.7 | Federal Signal | N | 92.05 | -1.58 | Morningstar Inc | O | 321.05 | -4.04 |
| Adtalem Global Educ | N | 93.54 | -1.11 | First Indl RT | N | 49.52 | -3.0 | Motorola Solutions | N | 455.15 | -1.30 |
| Allstate Corp | N | 186.04 | +1.3 | Fortune Brands Innov | N | 66.00 | -3.2 | NISource Inc | N | 35.77 | +2.0 |
| Aptargroup Inc | N | 153.43 | +5.1 | GATX | N | 150.73 | -2.10 | Nthn Trust Cp | O | 102.75 | -4.6 |
| Arch Dan Mid | N | 49.43 | -2.0 | Gallagher AJ | N | 279.77 | +3.35 | Old Republic | N | 34.18 | +1.2 |
| Baxter Intl | N | 29.58 | -0.8 | Gainenger WW | N | 1062.75 | +8.74 | Packaging Corp Am | N | 225.98 | -1.10 |
| Brunswick Corp | N | 65.80 | -4.4 | Hub Group Inc | N | 153.09 | -1.9 | Paylocity Hdgd | N | 196.77 | -3.10 |
| CBOE Global Markets | N | 190.84 | -3.2 | Hyatt Hotels Corp | N | 208.00 | -1.32 | RLI Corp | N | 156.31 | -5.02 |
| CCC Intelligent Solutions | O | 11.33 | -0.8 | IDEX Corp | N | 248.59 | -1.77 | Ryan Specialty Group | N | 50.74 | -1.00 |
| CDW Corp | O | 180.98 | +1.69 | ITW | N | 132.72 | -1.35 | Telephone & Data Systems | N | 32.71 | -5.5 |
| CF Industries | N | 88.75 | -1.01 | Ingredeion Inc | N | 123.86 | -3.86 | TransUnion | N | 90.20 | -2.16 |
| CME Group | O | 227.01 | +1.19 | JBT Corp | N | 249.21 | -7.08 | US Foods Holding | N | 67.22 | +2.0 |
| CNA Financial | N | 47.43 | +4.3 | Jones Lang LaSalle | N | 249.21 | -7.08 | Ulta Beauty Inc | O | 428.27 | -3.03 |
| ConAgra Brands Inc | N | 26.63 | -2.6 | Kemper Corp | N | 64.61 | -5.1 | United Airlines Hdgd | N | 101.21 | +2.64 |
| Deere Co | N | 413.27 | -4.73 | Kraft Heinz Co | O | 29.77 | -2.8 | US Cellular | N | 60.78 | -4.7 |
| Discover Fin Svcs | N | 177.60 | -1.61 | LKQ Corporation | O | 36.49 | -2.7 | Ventas Inc | N | 57.07 | +1.7 |
| Dover Corp | N | 187.98 | -0.5 | Littelfuse Inc | O | 239.05 | -1.91 | Walgreens Boots Alliance | O | 9.67 | +2.0 |
| Equity Lifestyle Prop | N | 65.38 | -3.4 | McDonalds Corp | N | 289.34 | -2.84 | Wintrust Financial | O | 127.58 | -1.0 |
| Equity Residential | N | 67.45 | -9.4 | Middleby Corp | O | 134.23 | -3.3 | Zebra Tech | O | 396.11 | +7.8 |
MOST ACTIVE STOCKS
NEW YORK STOCK EXCHANGE
| STOCK | CLOSE | CHG. |
|---|---|---|
| FuboTV Inc | 5.46 | +4.0 |
| Ford Motor | 9.76 | +1.6 |
| D-Wave Quantum Inc | 9.55 | +6.6 |
| NIO Inc | 4.51 | -2.0 |
| Ambev S.A. | 1.85 | +0.6 |
| Banco Bradesco ADS | 1.95 | +0.6 |
| Bank of America | 46.08 | +6.8 |
| AT&T Inc | 22.20 | -4.0 |
| Archer Aviation Inc | 11.14 | -3.1 |
| Uber Technologies | 66.15 | -1.6 |
| Pfizer Inc | 27.13 | +2.4 |
| Transocean Ltd | 4.16 | +1.8 |
| BigBear.ai Holdings | 3.96 | -3.4 |
| Verizon Communications | 38.92 | -6.9 |
| Vale SA | 8.56 | -0.6 |
| SES AI Corp | 1.75 | -3.3 |
| Snap Inc A | 12.55 | -0.2 |
| Joby Aviation Inc | 10.27 | +4.4 |
| Nu Holdings Ltd | 11.16 | +0.1 |
| ChargePoint Holdings | 1.22 | +0.2 |
| Itau Unibanco Hdgd | 5.17 | +1.0 |
| Carnival Corp | 23.84 | -2.9 |
| BlackBerry Ltd | 4.06 | -0.3 |
| QuantumScape Corp | 6.29 | -2.9 |
NASDAQ STOCK MARKET
| STOCK | CLOSE | CHG. |
|---|---|---|
| SRIVARU Holding Ltd | .08 | +0.4 |
| CERO Therapeutics | .05 | +0.1 |
| Algorhythmic Holdings | .23 | +0.8 |
| Hoth Therapeutics | 2.28 | +1.46 |
| Nvidia Corporation | 140.14 | -3.29 |
| Conduit Pharmaceutical | .09 | +0.2 |
| DotChat Inc | 8.93 | +6.97 |
| Blue Hat Interactive | .12 | +0.3 |
| SPI Energy Co Ltd | .68 | +2.5 |
| Crown Electrokinetics | .13 | -0.0 |
| Lucid Group Inc | 3.18 | -1.5 |
| Aurora Innovation A | 8.39 | +1.89 |
| Plug Power Inc | 2.95 | -2.0 |
| Arbe Robotics Ltd | 3.76 | -2.4 |
| Palantir Technol | 69.99 | -5.93 |
| Rigetti Computing | 18.39 | -1.12 |
| Syra Health Corp A | .74 | +2.5 |
| Innoviz Technologies | 2.20 | +2.1 |
| Immunovia Corp A | 2.36 | ... |
| Eyenovia Inc | .16 | +0.4 |
| Tesla Inc | 394.36 | -16.69 |
| Intel Corp | 20.01 | +1.4 |
| CNS Pharmaceuticals | .11 | -0.1 |
| Tonix Pharma | .29 | -0.3 |
FOREIGN MARKETS
INDEX
CLOSE
CHG./%
| Shanghai | 3229.64 | +22.7/+0.7 |
| Stoxx600 | 514.67 | +1.7/+0.3 |
| Nikkei | 40083.30 | +776.3/+2.0 |
| MSCI-EAFE | 2292.84 | +17.6/+0.8 |
| Bovespa | 121162.66 | +1141.1/+0.9 |
| FTSE 100 | 8245.28 | -4.4/-0.1 |
| CAC-40 | 7489.35 | +43.7/+0.6 |
LARGEST COMPANIES
Based on market capitalization
| STOCK | CLOSE | CHG. |
|---|---|---|
| Alphabet Inc C | 196.71 | -1.25 |
| Alphabet Inc A | 195.49 | -1.38 |
| Amazon.com Inc | 222.11 | -5.50 |
| Apple Inc | 242.21 | -2.79 |
| Berkshire Hath B | 452.92 | +1.51 |
| Broadcom Inc | 226.64 | -7.77 |
| Eli Lilly | 773.29 | +8.19 |
| Exxon Mobil Corp | 108.75 | +1.01 |
| JPMorgan Chase | 243.17 | +2.32 |
| MasterCard Inc | 511.40 | -5.33 |
| Meta Platforms Inc | 617.89 | -12.31 |
| Microsoft Corp | 422.37 | -5.48 |
| Nvidia Corporation | 140.14 | -9.29 |
| Oracle Corp | 162.03 | -3.66 |
| Taiwan Semicon | 211.42 | -8.59 |
| Tesla Inc | 394.36 | -16.69 |
| UnitedHealth Group | 514.25 | +5.8 |
| Visa Inc | 311.67 | -1.37 |
| WalMart Strs | 90.81 | -6.2 |
TREASURY YIELDS
DURATION
CLOSE
PREV.
| 3-month Disc | 4.21 | 4.21 |
| 6-month disc | 4.13 | 4.12 |
| 2-year | 4.29 | 4.27 |
| 10-year | 4.69 | 4.62 |
| 30-year | 4.92 | 4.84 |
SPOT METALS
CLOSE
PREV.
| Gold | $2656.70 | $2638.40 |
| Silver | $30.447 | $30.342 |
| Platinum | $962.80 | $929.30 |
INTEREST RATES
| Prime Rate | 7.50 |
| Discount Rate Primary | 4.40 |
| Fed Funds Target | 4.25-4.50 |
| Money Mkt Overnight Avg. | 0.41 |
FOREIGN EXCHANGE
| A U.S. Dollar buys... | |
| Argentina (Peso) | 1035.1967 |
| Australia (Dollar) | 1.6026 |
| Brazil (Real) | 6.1065 |
| Britain (Pound) | .8006 |
| Canada (Dollar) | 1.4347 |
| China (Yuan) | 7.3265 |
| Euro | .9656 |
| India (Rupee) | 85.778 |
| Israel (Shekel) | 3.6446 |
| Japan (Yen) | 157.78 |
| Mexico (Peso) | 20.2930 |
| Poland (Zloty) | 4.12 |
| So. Korea (Won) | 1454.55 |
| Taiwan (Dollar) | 32.75 |
| Thailand (Baht) | 34.57 |
LARGEST MUTUAL FUNDS
Based on total assets
| FUND | NAV | CHG | 1-YR |
|---|---|---|---|
| American Funds AMcPA m | 43.04 | -5.3 | +25.4 |
| American Funds AmrcnBalA m | 34.51 | -2.5 | +16.9 |
| American Funds AmrcnMutA m | 55.28 | -1.8 | +15.5 |
| American Funds CptWldGrnCmA m | 64.01 | -4.1 | +16.5 |
| American Funds CptLncBlrDmA m | 69.15 | -1.8 | +11.1 |
| American Funds FdmtInvSA m | 81.77 | -8.8 | +26.8 |
| American Funds GrfAmrcA m | 75.50 | -1.04 | +33.3 |
| American Funds InvAmrcA m | 24.49 | -0.6 | +11.9 |
| American Funds NwPrspctVA m | 58.12 | -5.1 | +28.1 |
| American Funds WAMtInvSA m | 62.55 | -6.2 | +20.1 |
| Baird Aggregate Bd Instl | 9.60 | -0.3 | +0.3 |
| Dodge & Cox Inc | 12.31 | -0.4 | +2.8 |
| Dodge & Cox Intl Stk I | 50.46 | +0.5 | +5.6 |
| Dodge & Cox Stk I | 259.22 | -5.0 | +15.4 |
| Fidelity 500IdxInvPrm | 205.18 | -2.30 | +27.5 |
| Fidelity BGrowth | 231.00 | -4.92 | +46.3 |
| Fidelity Balanced | 29.67 | -2.7 | +18.1 |
| Fidelity Contrafund | 21.44 | -2.9 | +40.2 |
| Fidelity ExMktDxInvPr | 92.08 | -1.09 | +22.8 |
| Fidelity GlobalExUSIdx | 14.29 | -0.5 | +8.0 |
| Fidelity GrCo | 40.88 | -0.7 | +43.0 |
| Fidelity IntlDxInStlPrm | 48.03 | -0.7 | +6.4 |
| Fidelity TtMktDxInStlPrm | 162.22 | -1.83 | +26.9 |
| Fidelity US Bond Index Prm | 10.15 | -0.4 | +1.8 |
| PIMCO Income Instl | 11.88 | -0.04 | +4.2 |
| Vanguard 500 Index Inv Prm | 190.84 | -3.2 | +24.2 |
| Vanguard Balanced Index Inv Prm | 32.71 | -5.5 | +16.9 |
| Vanguard Total Stock Mkt Index Inv Prm | 101.21 | +2.64 | +27.5 |
| Vanguard Total Intl Stock Index Inv Prm | 60.78 | -4.7 | +11.9 |
| Vanguard Total Bond Mkt Index Inv Prm | 36.49 | -2.7 | +0.3 |
| Vanguard Total Stock Mkt Index Inv Prm | 239.05 | -1.91 | +27.5 |
| Vanguard Total Intl Stock Index Inv Prm | 289.34 | -2.84 | +11.9 |
| Vanguard Total Bond Mkt Index Inv Prm | 134.23 | -3.3 | +0.3 |
| Vanguard Total Stock Mkt Index Inv Prm | 190.84 | -3.2 | +27.5 |
| Vanguard Total Intl Stock Index Inv Prm | 32.71 | -5.5 | +11.9 |
| Vanguard Total Bond Mkt Index Inv Prm | 101.21 | +2.64 | +0.3 |
| Vanguard Total Stock Mkt Index Inv Prm | 60.78 | -4.7 | +27.5 |
| Vanguard Total Intl Stock Index Inv Prm | 36.49 | -2.7 | +11.9 |
| Vanguard Total Bond Mkt Index Inv Prm | 239.05 | -1.91 | +0.3 |
| Vanguard Total Stock Mkt Index Inv Prm | 289.34 | -2.84 | +27.5 |
| Vanguard Total Intl Stock Index Inv Prm | 134.23 | -3.3 | +11.9 |
| Vanguard Total Bond Mkt Index Inv Prm | 190.84 | -3.2 | +0.3 |
| Vanguard Total Stock Mkt Index Inv Prm | 32.71 | -5.5 | +27.5 |
| Vanguard Total Intl Stock Index Inv Prm | 101.21 | +2.64 | +11.9 |
| Vanguard Total Bond Mkt Index Inv Prm | 60.78 | -4.7 | +0.3 |
| Vanguard Total Stock Mkt Index Inv Prm | 36.49 | -2.7 | +27.5 |
| Vanguard Total Intl Stock Index Inv Prm | 239.05 | -1.91 | +11.9 |
| Vanguard Total Bond Mkt Index Inv Prm | 289.34 | -2.84 | +0.3 |
| Vanguard Total Stock Mkt Index Inv Prm | 134.23 | -3.3 | +27.5 |
| Vanguard Total Intl Stock Index Inv Prm | 190.84 | -3.2 | +11.9 |
| Vanguard Total Bond Mkt Index Inv Prm | 32.71 | -5.5 | +0.3 |
| Vanguard Total Stock Mkt Index Inv Prm | 101.21 | +2.64 | +27.5 |
| Vanguard Total Intl Stock Index Inv Prm | 60.78 | -4.7 | +11.9 |
| Vanguard Total Bond Mkt Index Inv Prm | 36.49 | -2.7 | +0.3 |
| Vanguard Total Stock Mkt Index Inv Prm | 239.05 | -1.91 | +27.5 |
| Vanguard Total Intl Stock Index Inv Prm | 289.34 | -2.84 | +11.9 |
| Vanguard Total Bond Mkt Index Inv Prm | 134.23 | -3.3 | +0.3 |
D = Deferred sales charge, or redemption fee. m = Multiple fees or charges, usually a marketing fee. Source: Morningstar.