 Talk to Sales
 Benchmarks
View scores and output across OCR models spanning many document categories.
Want to run these evals on your own documents?
Talk to Sales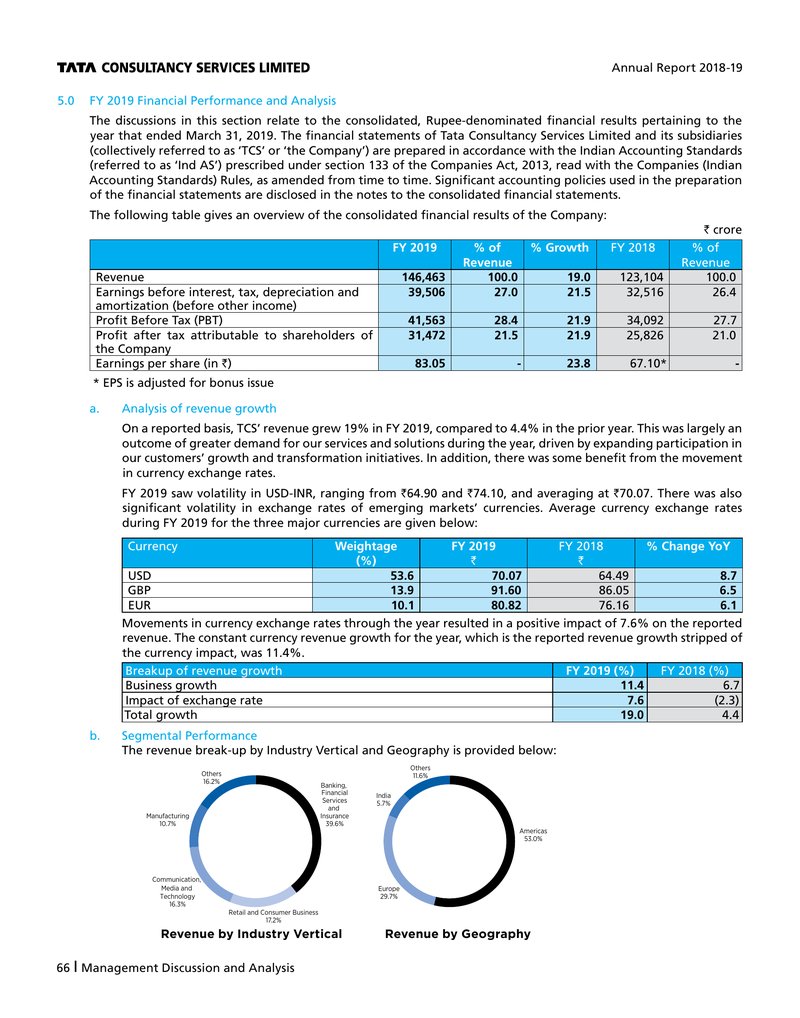
TATA CONSULTANCY SERVICES LIMITED
Annual Report 2018-19
5.0 FY 2019 Financial Performance and Analysis
The discussions in this section relate to the consolidated, Rupee-denominated financial results pertaining to the year that ended March 31, 2019. The financial statements of Tata Consultancy Services Limited and its subsidiaries (collectively referred to as 'TCS' or 'the Company') are prepared in accordance with the Indian Accounting Standards (referred to as 'Ind AS') prescribed under section 133 of the Companies Act, 2013, read with the Companies (Indian Accounting Standards) Rules, as amended from time to time. Significant accounting policies used in the preparation of the financial statements are disclosed in the notes to the consolidated financial statements.
The following table gives an overview of the consolidated financial results of the Company:
| FY 2019 | % of Revenue | % Growth | FY 2018 | % of Revenue | |
|---|---|---|---|---|---|
| Revenue | 146,463 | 100.0 | 19.0 | 123,104 | 100.0 |
| Earnings before interest, tax, depreciation and amortization (before other income) | 39,506 | 27.0 | 21.5 | 32,516 | 26.4 |
| Profit Before Tax (PBT) | 41,563 | 28.4 | 21.9 | 34,092 | 27.7 |
| Profit after tax attributable to shareholders of the Company | 31,472 | 21.5 | 21.9 | 25,826 | 21.0 |
| Earnings per share (in ) | 83.05 | - | 23.8 | 67.10* | - |
* EPS is adjusted for bonus issue
a. Analysis of revenue growth
On a reported basis, TCS' revenue grew 19% in FY 2019, compared to 4.4% in the prior year. This was largely an outcome of greater demand for our services and solutions during the year, driven by expanding participation in our customers' growth and transformation initiatives. In addition, there was some benefit from the movement in currency exchange rates.
FY 2019 saw volatility in USD-INR, ranging from and , and averaging at . There was also significant volatility in exchange rates of emerging markets' currencies. Average currency exchange rates during FY 2019 for the three major currencies are given below:
| Currency | Weightage (%) | FY 2019 | FY 2018 | % Change YoY |
|---|---|---|---|---|
| USD | 53.6 | 70.07 | 64.49 | 8.7 |
| GBP | 13.9 | 91.60 | 86.05 | 6.5 |
| EUR | 10.1 | 80.82 | 76.16 | 6.1 |
Movements in currency exchange rates through the year resulted in a positive impact of 7.6% on the reported revenue. The constant currency revenue growth for the year, which is the reported revenue growth stripped of the currency impact, was 11.4%.
| Breakup of revenue growth | FY 2019 (%) | FY 2018 (%) |
|---|---|---|
| Business growth | 11.4 | 6.7 |
| Impact of exchange rate | 7.6 | (2.3) |
| Total growth | 19.0 | 4.4 |
b. Segmental Performance
The revenue break-up by Industry Vertical and Geography is provided below:

Revenue by Industry Vertical
A donut chart showing the revenue distribution by Industry Vertical:
- Banking, Financial Services and Insurance: 39.6%
- Retail and Consumer Business: 17.2%
- Communication, Media and Technology: 16.3%
- Manufacturing: 10.7%
- Others: 16.2%

Revenue by Geography
A donut chart showing the revenue distribution by Geography:
- Americas: 53.0%
- Europe: 29.7%
- India: 5.7%
- Others: 11.6%
66 | Management Discussion and Analysis