Illustration of a person running.

Illustration of an open book.

Illustration of a pencil.

Illustration of an alarm clock.

Illustration of a briefcase.

Illustration of a magnifying glass.

Illustration of a pair of glasses.

Illustration of an open book.

Illustration of a graduation cap.
第一单元 扇形统计图
第一单元 扇形统计图
第一课时 认识扇形统计图
基础训练
一、看图填空。
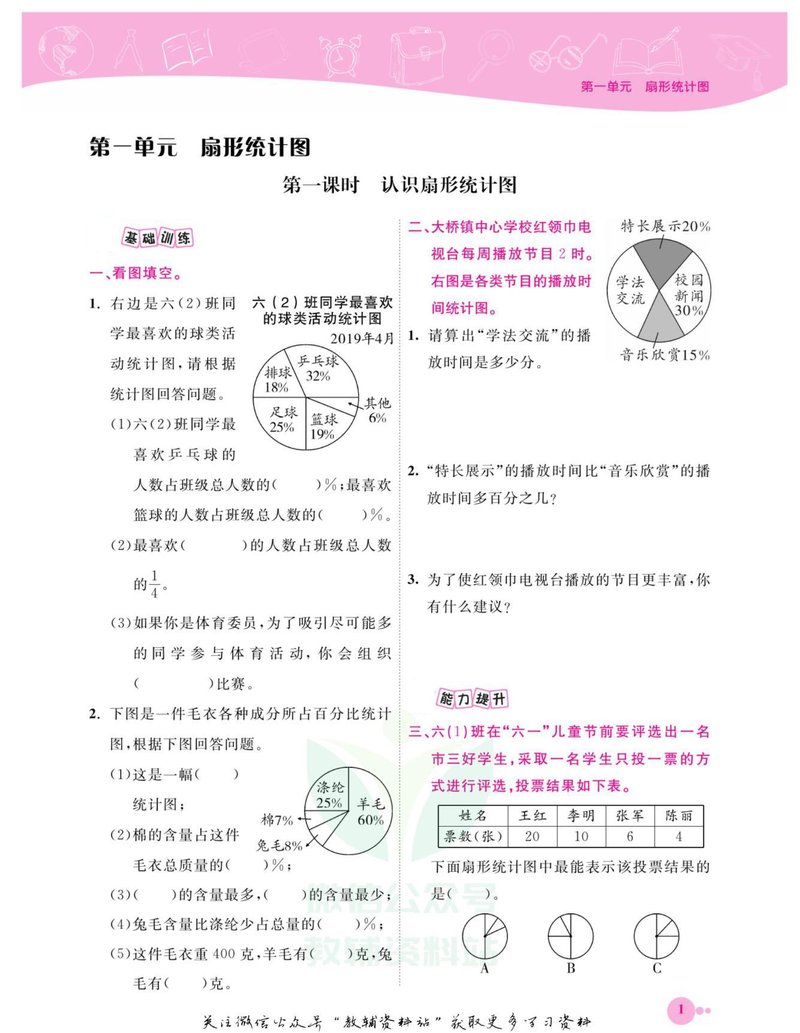
1. 右边是六(2)班同学最喜欢的球类活动统计图,请根据统计图回答问题。
六(2)班同学最喜欢的球类活动统计图
2019年4月

Pie chart showing the favorite ball sports of Class 6(2). Percentages are: Table Tennis (乒乓球) 32%, Volleyball (排球) 18%, Football (足球) 25%, Basketball (篮球) 19%, Others (其他) 6%.
(1) 六(2)班同学最喜欢乒乓球的人数占班级总人数的( )%;最喜欢篮球的人数占班级总人数的( )%。
(2) 最喜欢( )的人数占班级总人数的
。
(3) 如果你是体育委员,为了吸引尽可能多的同学参与体育活动,你会组织( )比赛。
2. 下图是一件毛衣各种成分所占百分比统计图,根据下图回答问题。

Pie chart showing the composition of a sweater. Percentages are: Wool (羊毛) 60%, Polyester (涤纶) 25%, Cotton (棉) 7%, Rabbit hair (兔毛) 8%.
(1) 这是一幅( )统计图;
(2) 棉的含量占这件毛衣总质量的( )%;
(3) ( )的含量最多, ( )的含量最少;
(4) 兔毛含量比涤纶少占总量的( )%;
(5) 这件毛衣重400克,羊毛有( )克,兔毛有( )克。
二、大桥镇中心学校红领巾电视台每周播放节目2时。右图是各类节目的播放时间统计图。

Pie chart showing the broadcast time distribution of various programs on the Red Scarf TV station. Percentages are: Special Display (特长展示) 20%, Campus News (校园新闻) 30%, Music Appreciation (音乐欣赏) 15%, Learning Exchange (学法交流) 35%.
1. 请算出“学法交流”的播放时间是多少分。
2. “特长展示”的播放时间比“音乐欣赏”的播放时间多百分之几?
3. 为了使红领巾电视台播放的节目更丰富,你有什么建议?
能力提升
三、六(1)班在“六一”儿童节前要评选出一名市三好学生,采取一名学生只投一票的方式进行评选,投票结果如下表。
|
姓名
|
王红
|
李明
|
张军
|
陈丽
|
|
票数(张)
|
20
|
10
|
6
|
4
|
下面扇形统计图中最能表示该投票结果的是( )。

Pie chart A, divided into four sectors. The largest sector is 50%, followed by 25%, 15%, and 10%. This chart correctly represents the voting results.

Pie chart B, divided into four sectors, none of which appears to be 50% or 25%.

Pie chart C, divided into four sectors, with two sectors appearing to be 25% each.
关注微信公众号“教辅资料站”获取更多学习资料
1
 Talk to Sales