 Talk to Sales
 Benchmarks
View scores and output across OCR models spanning many document categories.
Want to run these evals on your own documents?
Talk to Sales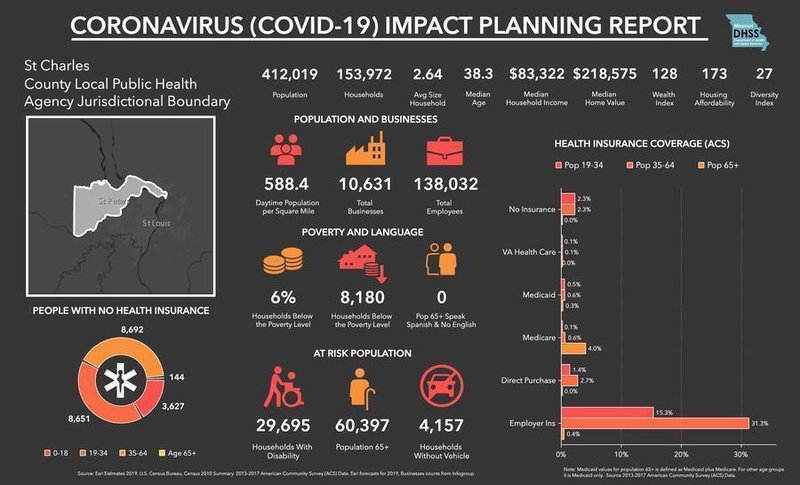
CORONAVIRUS (COVID-19) IMPACT PLANNING REPORT

St Charles
County Local Public Health
Agency Jurisdictional Boundary

| 412,019 | 153,972 | 2.64 | 38.3 | $83,322 | $218,575 | 128 | 173 | 27 |
| Population | Households |
Avg Size
Household |
Median
Age |
Median
Household Income |
Median
Home Value |
Wealth
Index |
Housing
Affordability |
Diversity
Index |
POPULATION AND BUSINESSES

|
|
|
|
| 588.4 | 10,631 | 138,032 |
|
Daytime Population
per Square Mile |
Total
Businesses |
Total
Employees |
POVERTY AND LANGUAGE

|
|
|
|
| 6% | 8,180 | 0 |
|
Households
Below the Poverty Level |
Households
Below the Poverty Level |
Pop 65+ Speak
Spanish & No English |
AT RISK POPULATION

|
|
|
|
| 29,695 | 60,397 | 4,157 |
|
Households With
Disability |
Population 65+ |
Households
Without Vehicle |
PEOPLE WITH NO HEALTH INSURANCE

8,692
144
3,627
8,651
0-18 19-34 35-64 Age 65+
HEALTH INSURANCE COVERAGE (ACS)

Legend: Pop 19-34 Pop 35-64 Pop 65+
| Pop 19-34 | Pop 35-64 | Pop 65+ | |
|---|---|---|---|
| No Insurance | 2.3% | 2.3% | 0.0% |
| VA Health Care | 0.1% | 0.1% | 0.0% |
| Medicaid | 0.5% | 0.6% | 0.3% |
| Medicare | 0.1% | 0.6% | 4.0% |
| Direct Purchase | 1.4% | 2.7% | 0.0% |
| Employer Ins | 15.3% | 31.3% | 0.4% |
Note: Medicaid values for population 65+ is defined as Medicaid plus Medicare. For other age groups it is Medicaid only. Source 2013-2017 American Community Survey (ACS) Data.
Source: Esri Estimates 2019, U.S. Census Bureau, Census 2010 Summary, 2013-2017 American Community Survey (ACS) Data. Esri forecasts for 2019, Businesses counts from Infogroup.