 Talk to Sales
 Benchmarks
View scores and output across OCR models spanning many document categories.
Want to run these evals on your own documents?
Talk to Sales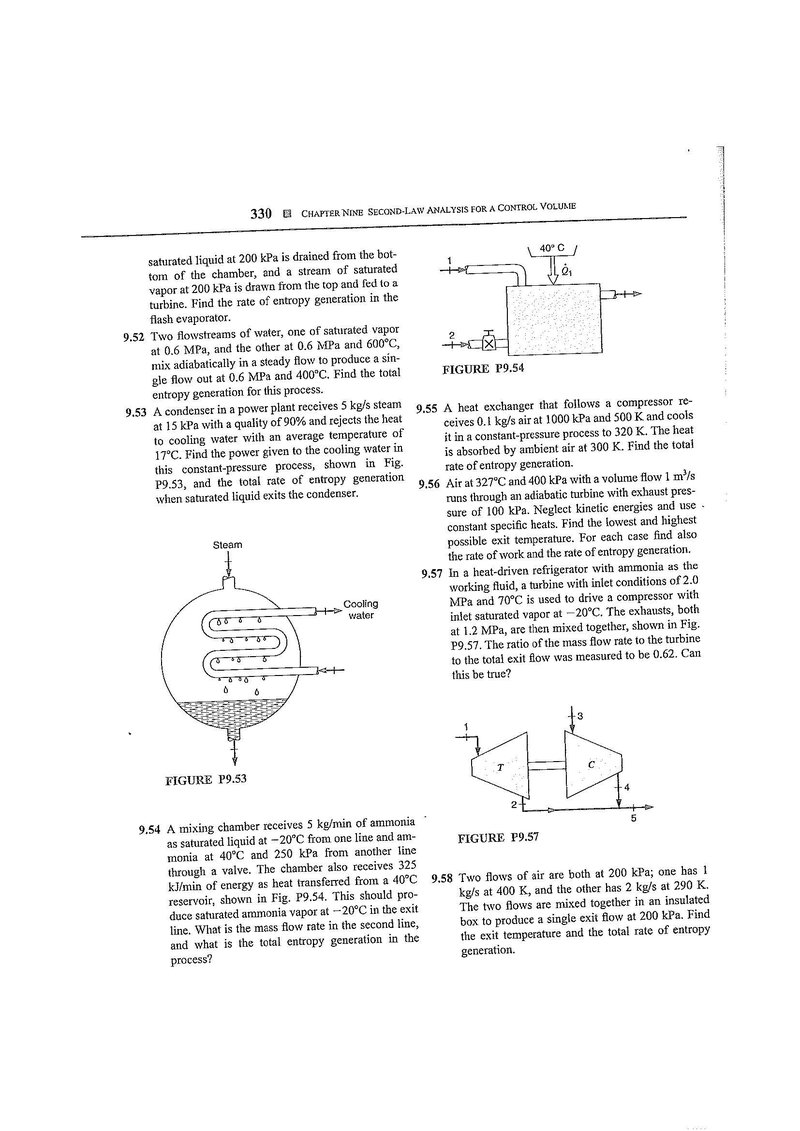
330 CHAPTER NINE SECOND-LAW ANALYSIS FOR A CONTROL VOLUME
saturated liquid at 200 kPa is drained from the bottom of the chamber, and a stream of saturated vapor at 200 kPa is drawn from the top and fed to a turbine. Find the rate of entropy generation in the flash evaporator.
9.52 Two flowstreams of water, one of saturated vapor at 0.6 MPa, and the other at 0.6 MPa and , mix adiabatically in a steady flow to produce a single flow out at 0.6 MPa and . Find the total entropy generation for this process.
9.53 A condenser in a power plant receives 5 kg/s steam at 15 kPa with a quality of 90% and rejects the heat to cooling water with an average temperature of . Find the power given to the cooling water in this constant-pressure process, shown in Fig. P9.53, and the total rate of entropy generation when saturated liquid exits the condenser.

FIGURE P9.53
9.54 A mixing chamber receives 5 kg/min of ammonia as saturated liquid at from one line and ammonia at and 250 kPa from another line through a valve. The chamber also receives 325 kJ/min of energy as heat transferred from a reservoir, shown in Fig. P9.54. This should produce saturated ammonia vapor at in the exit line. What is the mass flow rate in the second line, and what is the total entropy generation in the process?

FIGURE P9.54
9.55 A heat exchanger that follows a compressor receives 0.1 kg/s air at 1000 kPa and 500 K and cools it in a constant-pressure process to 320 K. The heat is absorbed by ambient air at 300 K. Find the total rate of entropy generation.
9.56 Air at and 400 kPa with a volume flow runs through an adiabatic turbine with exhaust pressure of 100 kPa. Neglect kinetic energies and use constant specific heats. Find the lowest and highest possible exit temperature. For each case find also the rate of work and the rate of entropy generation.
9.57 In a heat-driven refrigerator with ammonia as the working fluid, a turbine with inlet conditions of 2.0 MPa and is used to drive a compressor with inlet saturated vapor at . The exhausts, both at 1.2 MPa, are then mixed together, shown in Fig. P9.57. The ratio of the mass flow rate to the turbine to the total exit flow was measured to be 0.62. Can this be true?

FIGURE P9.57
9.58 Two flows of air are both at 200 kPa; one has 1 kg/s at 400 K, and the other has 2 kg/s at 290 K. The two flows are mixed together in an insulated box to produce a single exit flow at 200 kPa. Find the exit temperature and the total rate of entropy generation.