 Talk to Sales
 Benchmarks
View scores and output across OCR models spanning many document categories.
Want to run these evals on your own documents?
Talk to Sales Page 1 of 1
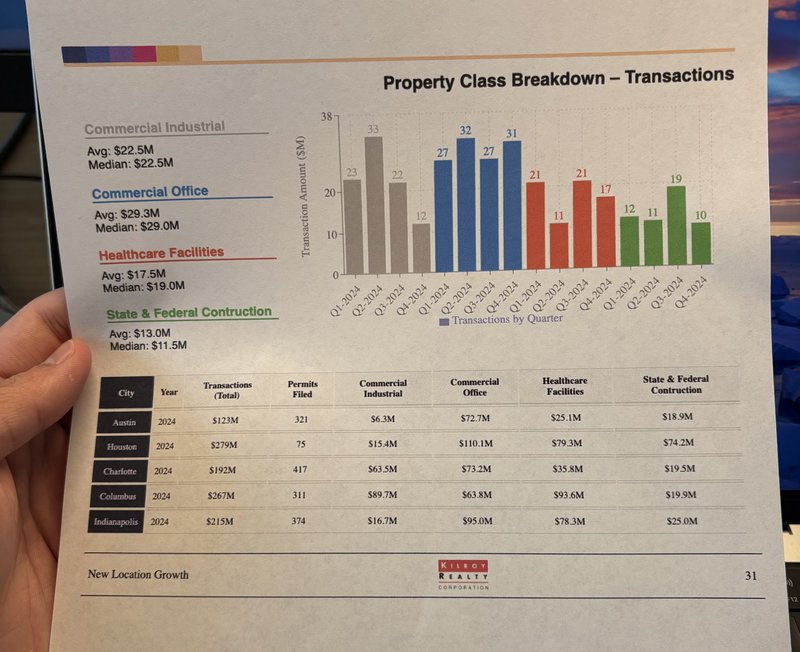
Property Class Breakdown – Transactions
Commercial Industrial
Avg: $22.5M
Median: $22.5M
Commercial Office
Avg: $29.3M
Median: $29.0M
Healthcare Facilities
Avg: $17.5M
Median: $19.0M
State & Federal Contruction
Avg: $13.0M
Median: $11.5M

Bar chart showing Transaction Amount ($M) by Quarter (Q1-Q4 2024) for four property classes. The Y-axis ranges from 0 to 38. The bars are grouped sequentially by property class type (Commercial Industrial, Commercial Office, Healthcare Facilities, State & Federal Contruction), with four quarters shown for each class.
| Quarter | Commercial Industrial | Commercial Office | Healthcare Facilities | State & Federal Contruction |
|---|---|---|---|---|
| Q1-2024 | 23 | 27 | 21 | 12 |
| Q2-2024 | 33 | 32 | 11 | 11 |
| Q3-2024 | 22 | 31 | 21 | 19 |
| Q4-2024 | 12 | 27 | 17 | 10 |
| City | Year | Transactions (Total) | Permits Filed | Commercial Industrial | Commercial Office | Healthcare Facilities | State & Federal Contruction |
|---|---|---|---|---|---|---|---|
| Austin | 2024 | $123M | 321 | $6.3M | $72.7M | $25.1M | $18.9M |
| Houston | 2024 | $279M | 75 | $15.4M | $110.1M | $79.3M | $74.2M |
| Charlotte | 2024 | $192M | 417 | $63.5M | $73.2M | $35.8M | $19.5M |
| Columbus | 2024 | $267M | 311 | $89.7M | $63.8M | $93.6M | $19.9M |
| Indianapolis | 2024 | $215M | 374 | $16.7M | $95.0M | $78.3M | $25.0M |
New Location Growth
KILROY
REALTY
CORPORATION
31