 Talk to Sales
 Benchmarks
View scores and output across OCR models spanning many document categories.
Want to run these evals on your own documents?
Talk to Sales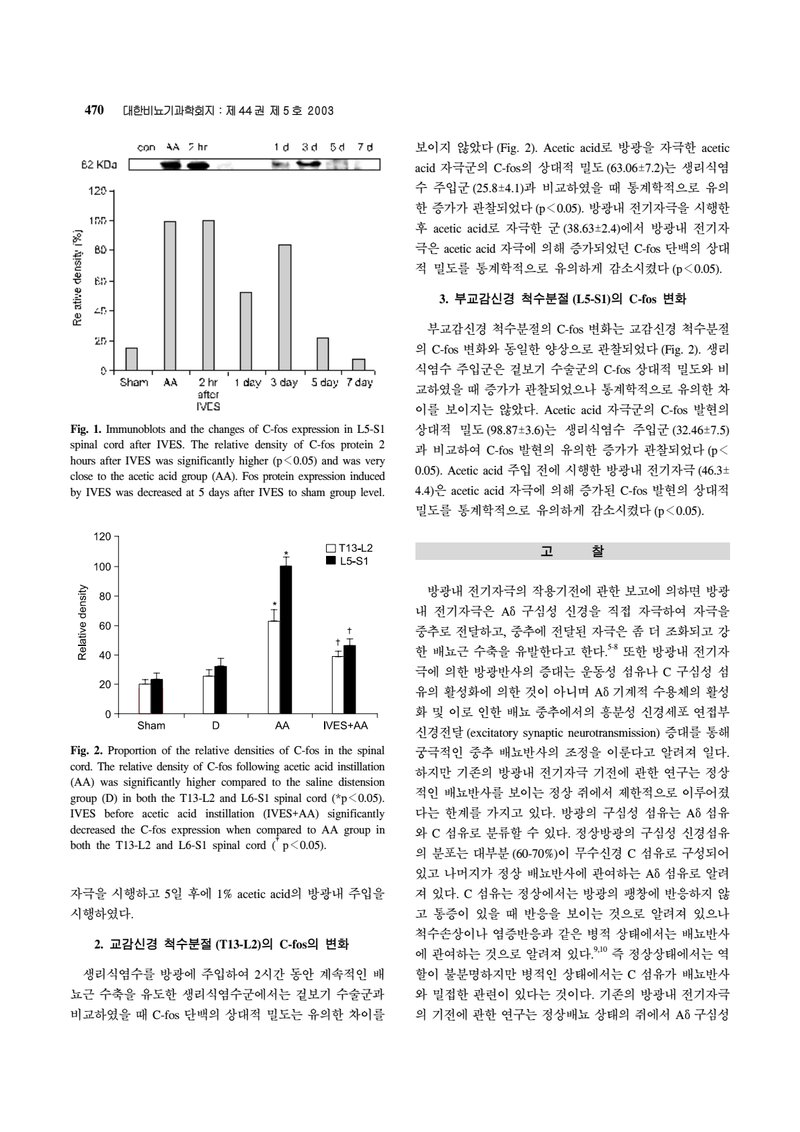
470 대한비뇨기과학회지 : 제 44 권 제 5 호 2003

Fig. 1. Immunoblots and the changes of C-fos expression in L5-S1 spinal cord after IVES. The relative density of C-fos protein 2 hours after IVES was significantly higher ( ) and was very close to the acetic acid group (AA). Fos protein expression induced by IVES was decreased at 5 days after IVES to sham group level.

Fig. 2. Proportion of the relative densities of C-fos in the spinal cord. The relative density of C-fos following acetic acid instillation (AA) was significantly higher compared to the saline distension group (D) in both the T13-L2 and L5-S1 spinal cord ( ). IVES before acetic acid instillation (IVES+AA) significantly decreased the C-fos expression when compared to AA group in both the T13-L2 and L5-S1 spinal cord ( ).
자극을 시행하고 5일 후에 1% acetic acid의 방광내 주입을 시행하였다.
2. 교감신경 척수분절 (T13-L2)의 C-fos의 변화
생리식염수를 방광에 주입하여 2시간 동안 계속적인 배뇨근 수축을 유도한 생리식염수군에서는 겉보기 수술군과 비교하였을 때 C-fos 단백의 상대적 밀도는 유의한 차이를
보이지 않았다 (Fig. 2). Acetic acid로 방광을 자극한 acetic acid 자극군의 C-fos의 상대적 밀도 ( )는 생리식염수 주입군 ( )과 비교하였을 때 통계학적으로 유의한 증가가 관찰되었다 ( ). 방광내 전기자극을 시행한 후 acetic acid로 자극한 군 ( )에서 방광내 전기자극은 acetic acid 자극에 의해 증가되었던 C-fos 단백의 상대적 밀도를 통계학적으로 유의하게 감소시켰다 ( ).
3. 부교감신경 척수분절 (L5-S1)의 C-fos 변화
부교감신경 척수분절의 C-fos 변화는 교감신경 척수분절의 C-fos 변화와 동일한 양상으로 관찰되었다 (Fig. 2). 생리식염수 주입군은 겉보기 수술군의 C-fos 상대적 밀도와 비교하였을 때 증가가 관찰되었으나 통계학적으로 유의한 차이를 보이지는 않았다. Acetic acid 자극군의 C-fos 발현의 상대적 밀도 ( )는 생리식염수 주입군 ( )과 비교하여 C-fos 발현의 유의한 증가가 관찰되었다 ( ). Acetic acid 주입 전에 시행한 방광내 전기자극 ( )은 acetic acid 자극에 의해 증가된 C-fos 발현의 상대적 밀도를 통계학적으로 유의하게 감소시켰다 ( ).
고 찰
방광내 전기자극의 작용기전에 관한 보고에 의하면 방광내 전기자극은 구심성 신경을 직접 자극하여 자극을 중추로 전달하고, 중추에 전달된 자극은 좀 더 조화되고 강한 배뇨근 수축을 유발한다고 한다. 5,8 또한 방광내 전기자극에 의한 방광반사의 증대는 운동성 섬유나 C 구심성 섬유의 활성화에 의한 것이 아니며 기계적 수용체의 활성화 및 이로 인한 배뇨 중추에서의 흥분성 신경세포 연접부 신경전달 (excitatory synaptic neurotransmission) 증대를 통해 궁극적인 중추 배뇨반사의 조정을 이룬다고 알려져 있다. 하지만 기존의 방광내 전기자극 기전에 관한 연구는 정상적인 배뇨반사를 보이는 정상 쥐에서 제한적으로 이루어졌다는 한계를 가지고 있다. 방광의 구심성 섬유는 섬유와 C 섬유로 분류할 수 있다. 정상방광의 구심성 신경섬유의 분포는 대부분 (60-70%)이 무수신경 C 섬유로 구성되어 있고 나머지가 정상 배뇨반사에 관여하는 섬유로 알려져 있다. C 섬유는 정상에서는 방광의 팽창에 반응하지 않고 통증이 있을 때 반응을 보이는 것으로 알려져 있으나 척수손상이나 염증반응과 같은 병적 상태에서는 배뇨반사에 관여하는 것으로 알려져 있다. 9,10 즉 정상상태에서는 역할이 불분명하지만 병적인 상태에서는 C 섬유가 배뇨반사와 밀접한 관련이 있다는 것이다. 기존의 방광내 전기자극의 기전에 관한 연구는 정상배뇨 상태의 쥐에서 구심성