 Talk to Sales
 Benchmarks
View scores and output across OCR models spanning many document categories.
Want to run these evals on your own documents?
Talk to Sales Page 1 of 1
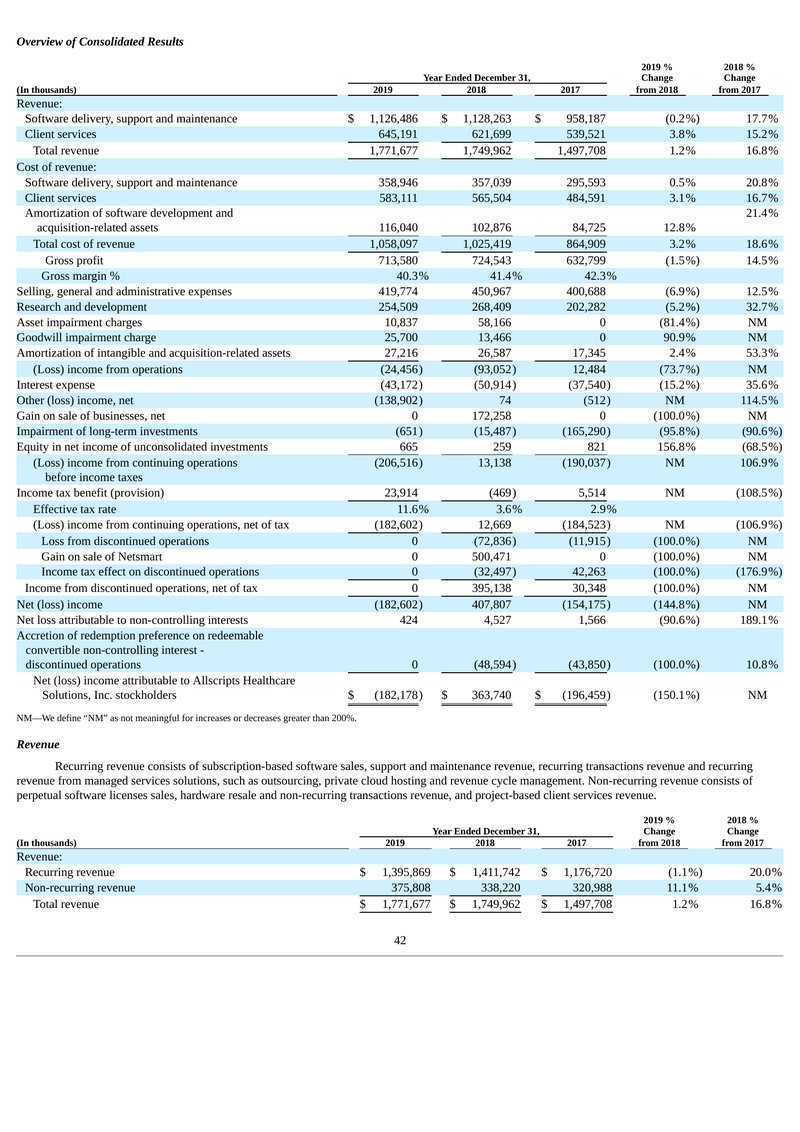
Overview of Consolidated Results
| (In thousands) | Year Ended December 31, |
2019 %
Change from 2018 |
2018 %
Change from 2017 |
||
|---|---|---|---|---|---|
| 2019 | 2018 | 2017 | |||
| Revenue: | |||||
| Software delivery, support and maintenance | $ 1,126,486 | $ 1,128,263 | $ 958,187 | (0.2%) | 17.7% |
| Client services | 645,191 | 621,699 | 539,521 | 3.8% | 15.2% |
| Total revenue | 1,771,677 | 1,749,962 | 1,497,708 | 1.2% | 16.8% |
| Cost of revenue: | |||||
| Software delivery, support and maintenance | 358,946 | 357,039 | 295,593 | 0.5% | 20.8% |
| Client services | 583,111 | 565,504 | 484,591 | 3.1% | 16.7% |
|
Amortization of software development and
acquisition-related assets |
116,040 | 102,876 | 84,725 | 12.8% | 21.4% |
| Total cost of revenue | 1,058,097 | 1,025,419 | 864,909 | 3.2% | 18.6% |
| Gross profit | 713,580 | 724,543 | 632,799 | (1.5%) | 14.5% |
| Gross margin % | 40.3% | 41.4% | 42.3% | ||
| Selling, general and administrative expenses | 419,774 | 450,967 | 400,688 | (6.9%) | 12.5% |
| Research and development | 254,509 | 268,409 | 202,282 | (5.2%) | 32.7% |
| Asset impairment charges | 10,837 | 58,166 | 0 | (81.4%) | NM |
| Goodwill impairment charge | 25,700 | 13,466 | 0 | 90.9% | NM |
| Amortization of intangible and acquisition-related assets | 27,216 | 26,587 | 17,345 | 2.4% | 53.3% |
| (Loss) income from operations | (24,456) | (93,052) | 12,484 | (73.7%) | NM |
| Interest expense | (43,172) | (50,914) | (37,540) | (15.2%) | 35.6% |
| Other (loss) income, net | (138,902) | 74 | (512) | NM | 114.5% |
| Gain on sale of businesses, net | 0 | 172,258 | 0 | (100.0%) | NM |
| Impairment of long-term investments | (651) | (15,487) | (165,290) | (95.8%) | (90.6%) |
| Equity in net income of unconsolidated investments | 665 | 259 | 821 | 156.8% | (68.5%) |
|
(Loss) income from continuing operations
before income taxes |
(206,516) | 13,138 | (190,037) | NM | 106.9% |
| Income tax benefit (provision) | 23,914 | (469) | 5,514 | NM | (108.5%) |
| Effective tax rate | 11.6% | 3.6% | 2.9% | ||
| (Loss) income from continuing operations, net of tax | (182,602) | 12,669 | (184,523) | NM | (106.9%) |
| Loss from discontinued operations | 0 | (72,836) | (11,915) | (100.0%) | NM |
| Gain on sale of Netsmart | 0 | 500,471 | 0 | (100.0%) | NM |
| Income tax effect on discontinued operations | 0 | (32,497) | 42,263 | (100.0%) | (176.9%) |
| Income from discontinued operations, net of tax | 0 | 395,138 | 30,348 | (100.0%) | NM |
| Net (loss) income | (182,602) | 407,807 | (154,175) | (144.8%) | NM |
| Net loss attributable to non-controlling interests | 424 | 4,527 | 1,566 | (90.6%) | 189.1% |
|
Accretion of redemption preference on redeemable
convertible non-controlling interest - discontinued operations |
0 | (48,594) | (43,850) | (100.0%) | 10.8% |
|
Net (loss) income attributable to Allscripts Healthcare
Solutions, Inc. stockholders |
$ (182,178) | $ 363,740 | $ (196,459) | (150.1%) | NM |
NM—We define “NM” as not meaningful for increases or decreases greater than 200%.
Revenue
Recurring revenue consists of subscription-based software sales, support and maintenance revenue, recurring transactions revenue and recurring revenue from managed services solutions, such as outsourcing, private cloud hosting and revenue cycle management. Non-recurring revenue consists of perpetual software licenses sales, hardware resale and non-recurring transactions revenue, and project-based client services revenue.
| (In thousands) | Year Ended December 31, |
2019 %
Change from 2018 |
2018 %
Change from 2017 |
||
|---|---|---|---|---|---|
| 2019 | 2018 | 2017 | |||
| Revenue: | |||||
| Recurring revenue | $ 1,395,869 | $ 1,411,742 | $ 1,176,720 | (1.1%) | 20.0% |
| Non-recurring revenue | 375,808 | 338,220 | 320,988 | 11.1% | 5.4% |
| Total revenue | $ 1,771,677 | $ 1,749,962 | $ 1,497,708 | 1.2% | 16.8% |
42