 Talk to Sales
 Benchmarks
View scores and output across OCR models spanning many document categories.
Want to run these evals on your own documents?
Talk to Sales Page 1 of 1
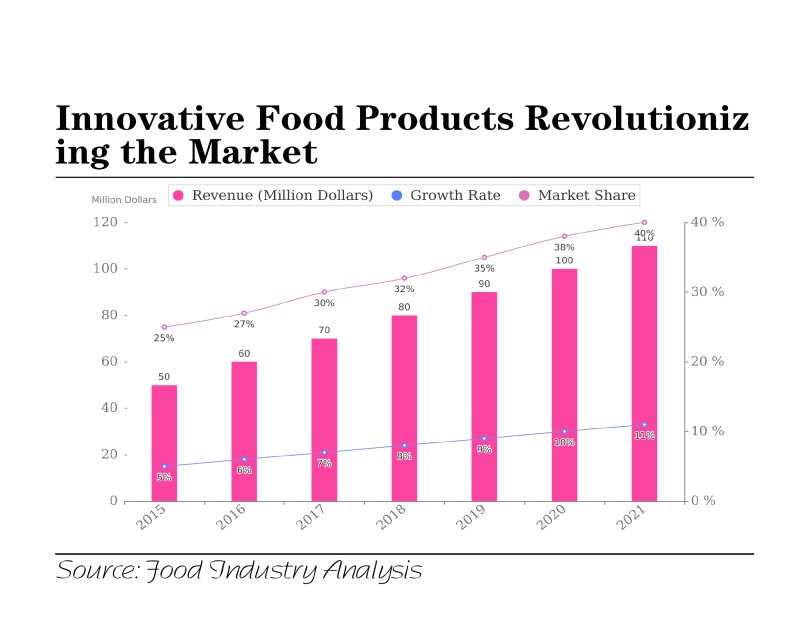
Innovative Food Products Revolutionizing the Market

Chart illustrating the growth of innovative food products from 2015 to 2021. The chart displays Revenue (Million Dollars) as bars, Growth Rate as a line, and Market Share as a line.
| Year | Revenue (Million Dollars) | Growth Rate | Market Share |
|---|---|---|---|
| 2015 | 50 | 5% | 25% |
| 2016 | 60 | 6% | 27% |
| 2017 | 70 | 7% | 30% |
| 2018 | 80 | 8% | 32% |
| 2019 | 90 | 9% | 35% |
| 2020 | 100 | 10% | 38% |
| 2021 | 110 | 11% | 40% |
Source: Food Industry Analysis