 Talk to Sales
 Benchmarks
View scores and output across OCR models spanning many document categories.
Want to run these evals on your own documents?
Talk to Sales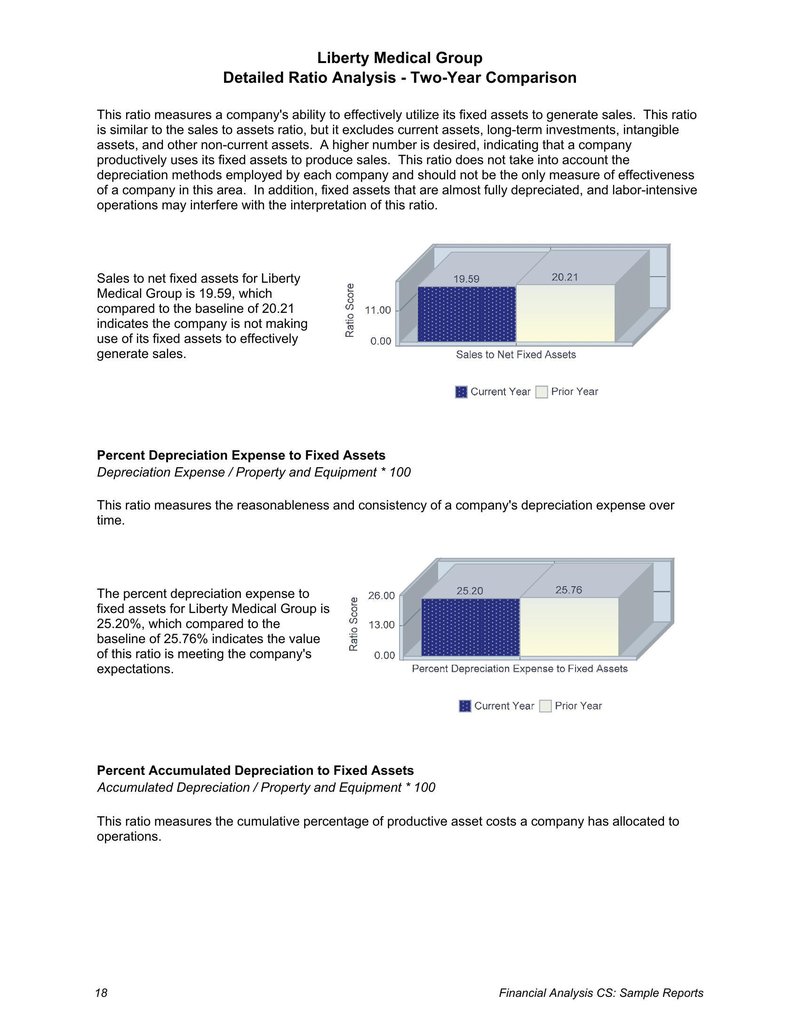
Liberty Medical GroupDetailed Ratio Analysis - Two-Year Comparison
This ratio measures a company's ability to effectively utilize its fixed assets to generate sales. This ratio is similar to the sales to assets ratio, but it excludes current assets, long-term investments, intangible assets, and other non-current assets. A higher number is desired, indicating that a company productively uses its fixed assets to produce sales. This ratio does not take into account the depreciation methods employed by each company and should not be the only measure of effectiveness of a company in this area. In addition, fixed assets that are almost fully depreciated, and labor-intensive operations may interfere with the interpretation of this ratio.
Sales to net fixed assets for Liberty Medical Group is 19.59, which compared to the baseline of 20.21 indicates the company is not making use of its fixed assets to effectively generate sales.

Bar chart comparing Sales to Net Fixed Assets for the Current Year (19.59) and Prior Year (20.21).
| Year | Sales to Net Fixed Assets |
|---|---|
| Current Year | 19.59 |
| Prior Year | 20.21 |
The Y-axis is Ratio Score, ranging from 0.00 to 11.00. The X-axis is labeled "Sales to Net Fixed Assets". The Current Year value (19.59) is lower than the Prior Year value (20.21). Legend: Current Year (Dark Blue patterned bar), Prior Year (Light Yellow bar).
Percent Depreciation Expense to Fixed Assets
Depreciation Expense / Property and Equipment * 100
This ratio measures the reasonableness and consistency of a company's depreciation expense over time.
The percent depreciation expense to fixed assets for Liberty Medical Group is 25.20%, which compared to the baseline of 25.76% indicates the value of this ratio is meeting the company's expectations.

Bar chart comparing Percent Depreciation Expense to Fixed Assets for the Current Year (25.20) and Prior Year (25.76).
| Year | Percent Depreciation Expense to Fixed Assets |
|---|---|
| Current Year | 25.20 |
| Prior Year | 25.76 |
The Y-axis is Ratio Score, ranging from 0.00 to 26.00, with an intermediate mark at 13.00. The X-axis is labeled "Percent Depreciation Expense to Fixed Assets". The Current Year value (25.20) is slightly lower than the Prior Year value (25.76). Legend: Current Year (Dark Blue patterned bar), Prior Year (Light Yellow bar).
Percent Accumulated Depreciation to Fixed Assets
Accumulated Depreciation / Property and Equipment * 100
This ratio measures the cumulative percentage of productive asset costs a company has allocated to operations.
18
Financial Analysis CS: Sample Reports