 Talk to Sales
 Benchmarks
View scores and output across OCR models spanning many document categories.
Want to run these evals on your own documents?
Talk to Sales Page 1 of 1
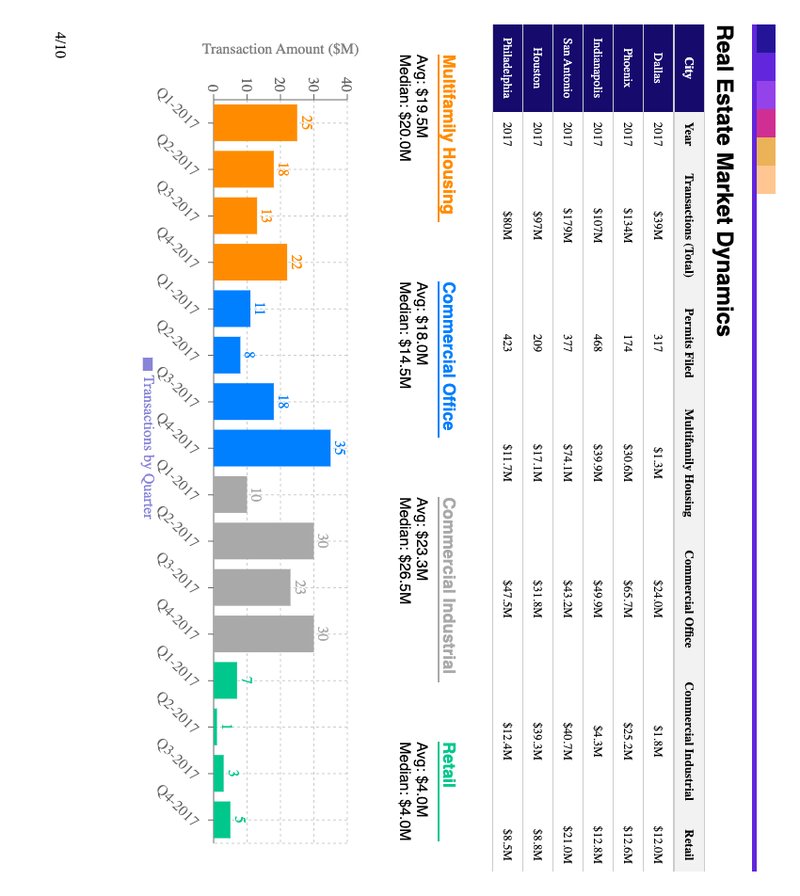
Real Estate Market Dynamics
| City | Year | Transactions (Total) | Permits Filed | Multifamily Housing | Commercial Office | Commercial Industrial | Retail |
|---|---|---|---|---|---|---|---|
| Dallas | 2017 | $39M | 317 | $1.3M | $24.0M | $1.8M | $12.0M |
| Phoenix | 2017 | $134M | 174 | $30.6M | $65.7M | $25.2M | $12.6M |
| Indianapolis | 2017 | $107M | 468 | $39.9M | $49.9M | $4.3M | $12.8M |
| San Antonio | 2017 | $179M | 377 | $74.1M | $43.2M | $40.7M | $21.0M |
| Houston | 2017 | $97M | 209 | $17.1M | $31.8M | $39.3M | $8.8M |
| Philadelphia | 2017 | $80M | 423 | $11.7M | $47.5M | $12.4M | $8.5M |
Multifamily Housing
Avg: $19.5M
Median: $20.0M
Commercial Office
Avg: $18.0M
Median: $14.5M
Commercial Industrial
Avg: $23.3M
Median: $26.5M
Retail
Avg: $4.0M
Median: $4.0M

Bar chart showing Transaction Amount ($M) by Quarter for four real estate sectors. The X-axis is Transaction Amount ($M) ranging from 0 to 40. The Y-axis lists quarters Q1-2017 through Q4-2017 for each sector group.
Legend: Transactions by Quarter
| Sector | Quarter | Transaction Amount ($M) |
|---|---|---|
| Multifamily Housing | Q1-2017 | 25 |
| Multifamily Housing | Q2-2017 | 18 |
| Multifamily Housing | Q3-2017 | 13 |
| Multifamily Housing | Q4-2017 | 22 |
| Commercial Office | Q1-2017 | 11 |
| Commercial Office | Q2-2017 | 8 |
| Commercial Office | Q3-2017 | 18 |
| Commercial Office | Q4-2017 | 35 |
| Commercial Industrial | Q1-2017 | 10 |
| Commercial Industrial | Q2-2017 | 30 |
| Commercial Industrial | Q3-2017 | 23 |
| Commercial Industrial | Q4-2017 | 30 |
| Retail | Q1-2017 | 7 |
| Retail | Q2-2017 | 1 |
| Retail | Q3-2017 | 3 |
| Retail | Q4-2017 | 5 |