 Talk to Sales
 Benchmarks
View scores and output across OCR models spanning many document categories.
Want to run these evals on your own documents?
Talk to Sales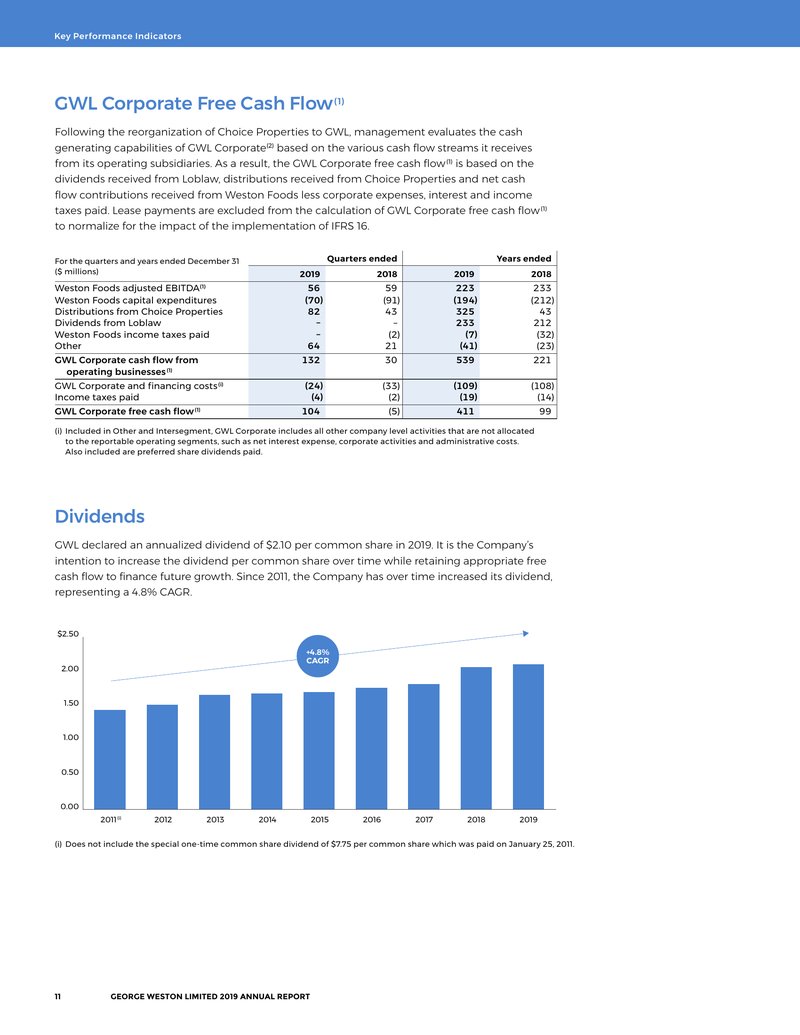
Key Performance Indicators
GWL Corporate Free Cash Flow (1)
Following the reorganization of Choice Properties to GWL, management evaluates the cash generating capabilities of GWL Corporate (2) based on the various cash flow streams it receives from its operating subsidiaries. As a result, the GWL Corporate free cash flow (1) is based on the dividends received from Loblaw, distributions received from Choice Properties and net cash flow contributions received from Weston Foods less corporate expenses, interest and income taxes paid. Lease payments are excluded from the calculation of GWL Corporate free cash flow (1) to normalize for the impact of the implementation of IFRS 16.
|
For the quarters and years ended December 31
($ millions) |
Quarters ended | Years ended | ||
|---|---|---|---|---|
| 2019 | 2018 | 2019 | 2018 | |
| Weston Foods adjusted EBITDA (1) | 56 | 59 | 223 | 233 |
| Weston Foods capital expenditures | (70) | (91) | (194) | (212) |
| Distributions from Choice Properties | 82 | 43 | 325 | 43 |
| Dividends from Loblaw | - | - | 233 | 212 |
| Weston Foods income taxes paid | - | (2) | (7) | (32) |
| Other | 64 | 21 | (41) | (23) |
| GWL Corporate cash flow from operating businesses (1) | 132 | 30 | 539 | 221 |
| GWL Corporate and financing costs (i) | (24) | (33) | (109) | (108) |
| Income taxes paid | (4) | (2) | (19) | (14) |
| GWL Corporate free cash flow (1) | 104 | (5) | 411 | 99 |
(i) Included in Other and Intersegment, GWL Corporate includes all other company level activities that are not allocated to the reportable operating segments, such as net interest expense, corporate activities and administrative costs. Also included are preferred share dividends paid.
Dividends
GWL declared an annualized dividend of $2.10 per common share in 2019. It is the Company's intention to increase the dividend per common share over time while retaining appropriate free cash flow to finance future growth. Since 2011, the Company has over time increased its dividend, representing a 4.8% CAGR.

Bar chart illustrating the annual dividend per common share from 2011 to 2019. The dividend has increased steadily over this period, representing a 4.8% Compound Annual Growth Rate (CAGR).
| Year | Dividend ($) |
|---|---|
| 2011 (i) | ~1.40 |
| 2012 | ~1.50 |
| 2013 | ~1.55 |
| 2014 | ~1.55 |
| 2015 | ~1.60 |
| 2016 | ~1.70 |
| 2017 | ~1.80 |
| 2018 | ~1.90 |
| 2019 | 2.10 |
(i) Does not include the special one-time common share dividend of $7.75 per common share which was paid on January 25, 2011.
11
GEORGE WESTON LIMITED 2019 ANNUAL REPORT