 Talk to Sales
 Benchmarks
View scores and output across OCR models spanning many document categories.
Want to run these evals on your own documents?
Talk to Sales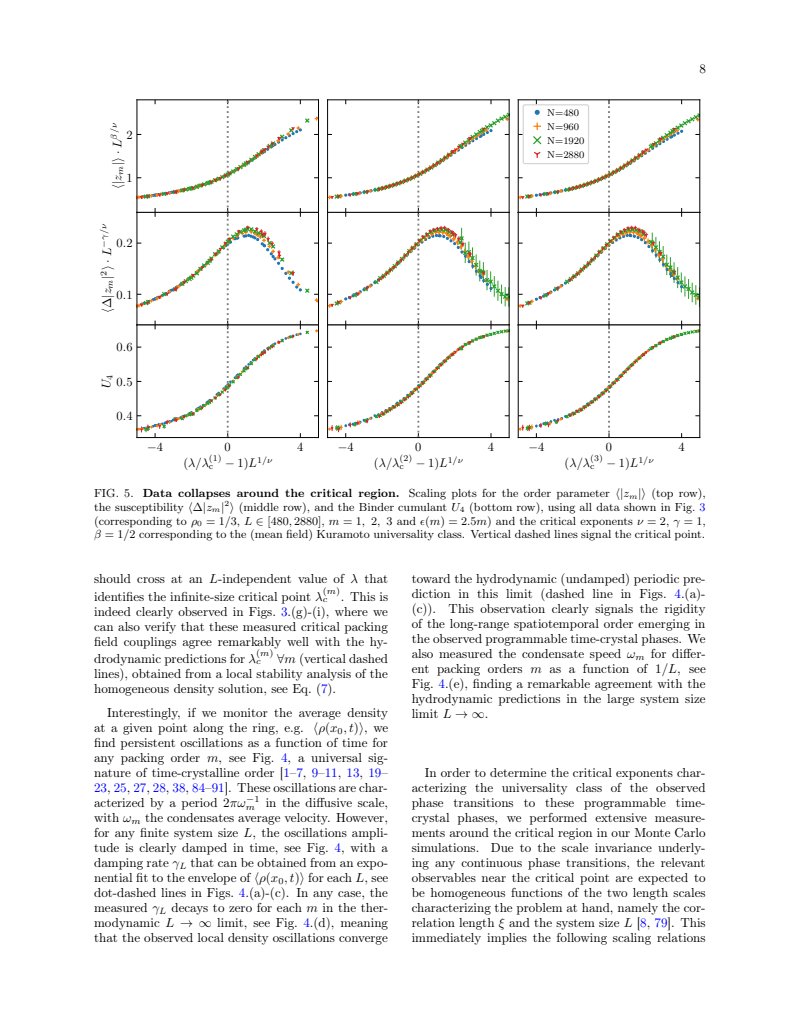
8

Figure 5 displays data collapse plots for three observables (order parameter, susceptibility, and Binder cumulant) across different packing orders . Data is shown for system sizes (blue circle), (orange plus), (green cross), and (red inverted triangle). The plots are arranged in three rows corresponding to the observables and three columns corresponding to the packing orders .
The x-axis for all plots is the scaled distance from the critical point: . The y-axis scales are:
- Top row (Order parameter): .
- Middle row (Susceptibility): .
- Bottom row (Binder cumulant): .
The data points for different system sizes collapse onto a single curve, indicating universality. Vertical dashed lines mark the critical point .
FIG. 5. Data collapses around the critical region. Scaling plots for the order parameter (top row), the susceptibility (middle row), and the Binder cumulant (bottom row), using all data shown in Fig. 3 (corresponding to , , and ) and the critical exponents , , corresponding to the (mean field) Kuramoto universality class. Vertical dashed lines signal the critical point.
should cross at an -independent value of that identifies the infinite-size critical point . This is indeed clearly observed in Figs. 3.(g)-(i), where we can also verify that these measured critical packing field couplings agree remarkably well with the hydrodynamic predictions for (vertical dashed lines), obtained from a local stability analysis of the homogeneous density solution, see Eq. (7).
Interestingly, if we monitor the average density at a given point along the ring, e.g. , we find persistent oscillations as a function of time for any packing order , see Fig. 4, a universal signature of time-crystalline order [1–7, 9–11, 13, 19–23, 25, 27, 28, 38, 84–91]. These oscillations are characterized by a period in the diffusive scale, with the condensates average velocity. However, for any finite system size , the oscillations amplitude is clearly damped in time, see Fig. 4, with a damping rate that can be obtained from an exponential fit to the envelope of for each , see dot-dashed lines in Figs. 4.(a)-(c). In any case, the measured decays to zero for each in the thermodynamic limit, see Fig. 4.(d), meaning that the observed local density oscillations converge
toward the hydrodynamic (undamped) periodic prediction in this limit (dashed line in Figs. 4.(a)-(c)). This observation clearly signals the rigidity of the long-range spatiotemporal order emerging in the observed programmable time-crystal phases. We also measured the condensate speed for different packing orders as a function of , see Fig. 4.(e), finding a remarkable agreement with the hydrodynamic predictions in the large system size limit .
In order to determine the critical exponents characterizing the universality class of the observed phase transitions to these programmable time-crystal phases, we performed extensive measurements around the critical region in our Monte Carlo simulations. Due to the scale invariance underlying any continuous phase transitions, the relevant observables near the critical point are expected to be homogeneous functions of the two length scales characterizing the problem at hand, namely the correlation length and the system size [8, 79]. This immediately implies the following scaling relations