Talk to Sales

Benchmarks

View scores and output across OCR models spanning many document categories.

Want to run these evals on your own documents?

Talk to Sales
Page 1

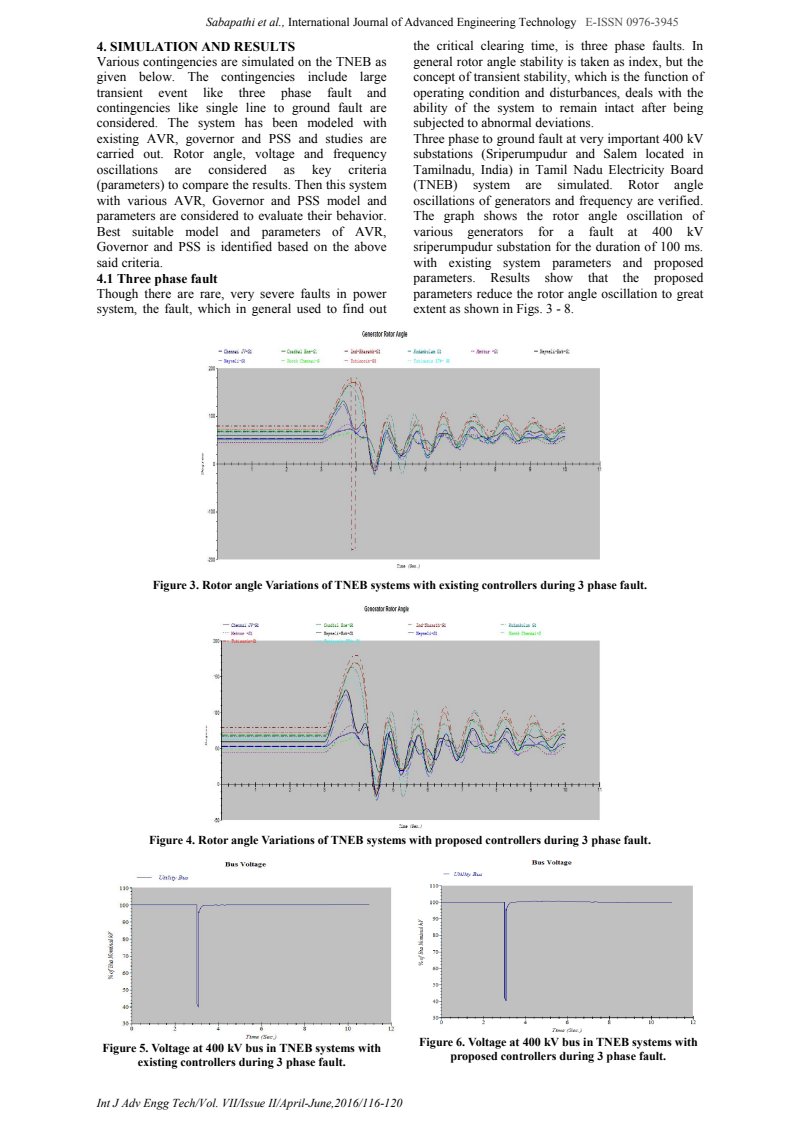
Sabapathi et al., International Journal of Advanced Engineering Technology E-ISSN 0976-3945

4. SIMULATION AND RESULTS

Various contingencies are simulated on the TNEB as given below. The contingencies include large transient event like three phase fault and contingencies like single line to ground fault are considered. The system has been modeled with existing AVR, governor and PSS and studies are carried out. Rotor angle, voltage and frequency oscillations are considered as key criteria (parameters) to compare the results. Then this system with various AVR, Governor and PSS model and parameters are considered to evaluate their behavior. Best suitable model and parameters of AVR, Governor and PSS is identified based on the above said criteria.

4.1 Three phase fault

Though there are rare, very severe faults in power system, the fault, which in general used to find out

the critical clearing time, is three phase faults. In general rotor angle stability is taken as index, but the concept of transient stability, which is the function of operating condition and disturbances, deals with the ability of the system to remain intact after being subjected to abnormal deviations.

Three phase to ground fault at very important 400 kV substations (Sriperumpudur and Salem located in Tamilnadu, India) in Tamil Nadu Electricity Board (TNEB) system are simulated. Rotor angle oscillations of generators and frequency are verified. The graph shows the rotor angle oscillation of various generators for a fault at 400 kV sriperumpudur substation for the duration of 100 ms. with existing system parameters and proposed parameters. Results show that the proposed parameters reduce the rotor angle oscillation to great extent as shown in Figs. 3 - 8.

Figure 3: Graph showing Generator Rotor Angle variations (in Degrees) versus Time (in Sec.) for TNEB systems with existing controllers during a 3 phase fault. The graph displays rotor angle oscillations for generators: Chennai JV-G1, Coadtal Ene-G, Ind-Bharath-G1, Kudankulam G1, Mettur -G1, Neyveli-G1, North Chennai-G, Tuticorin-G1, Tuticorin ST4, and Neyveli-Ext-G. The rotor angle shows large oscillations, with one generator (Mettur -G1, dashed red line) experiencing a severe drop below -100 degrees around 3.5 seconds.

Figure 3. Rotor angle Variations of TNEB systems with existing controllers during 3 phase fault.

Figure 4: Graph showing Generator Rotor Angle variations (in Degrees) versus Time (in Sec.) for TNEB systems with proposed controllers during a 3 phase fault. The graph displays rotor angle oscillations for generators: Chennai JV-G1, Mettur -G1, Tuticorin-G1, Coadtal Ene-G1, Neyveli-Ext-G1, Ind-Bharath-G1, Neyveli-G1, Kudankulam G1, and North Chennai-G. Compared to Figure 3, the oscillations are significantly damped and the maximum deviation is reduced, staying below 200 degrees and above 50 degrees.

Figure 4. Rotor angle Variations of TNEB systems with proposed controllers during 3 phase fault.

Figure 5: Graph showing Bus Voltage (in % of Bus Nominal kV) versus Time (in Sec.) for the Utility Bus in TNEB systems with existing controllers during a 3 phase fault. The voltage drops sharply from 100% to approximately 40% around 3.5 seconds and recovers quickly, but the system experiences a significant transient.

Figure 5. Voltage at 400 kV bus in TNEB systems with existing controllers during 3 phase fault.

Figure 6: Graph showing Bus Voltage (in % of Bus Nominal kV) versus Time (in Sec.) for the Utility Bus in TNEB systems with proposed controllers during a 3 phase fault. The voltage drops sharply from 100% to approximately 40% around 3.5 seconds and recovers quickly, similar to Figure 5, indicating the proposed controllers primarily affect rotor angle stability rather than immediate voltage dip magnitude during the fault.

Figure 6. Voltage at 400 kV bus in TNEB systems with proposed controllers during 3 phase fault.

Int J Adv Engg Tech/Vol. VII/Issue II/April-June,2016/116-120