 Talk to Sales
 Benchmarks
View scores and output across OCR models spanning many document categories.
Want to run these evals on your own documents?
Talk to Sales Page 1 of 1
JAMA Network Open | Public Health
US Consumer Views on Using Digital Data for COVID-19 Control
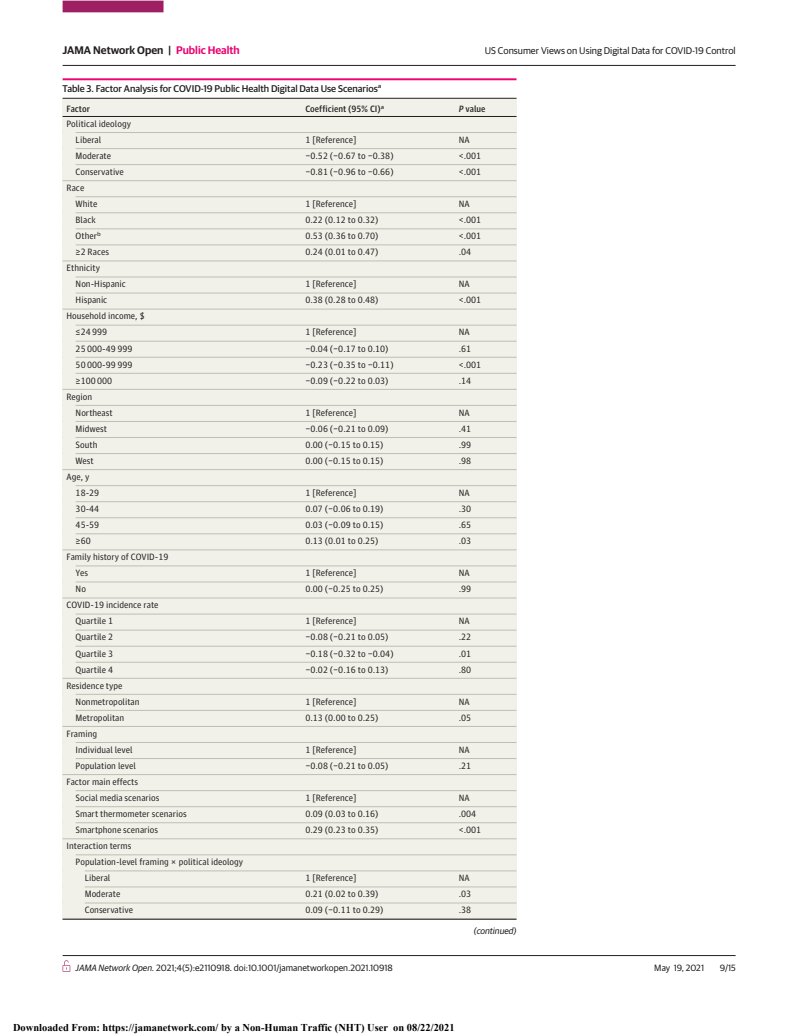
Table 3. Factor Analysis for COVID-19 Public Health Digital Data Use Scenarios a| Factor | Coefficient (95% CI) a | P value |
|---|---|---|
| Political ideology | ||
| Liberal | 1 [Reference] | NA |
| Moderate | -0.52 (-0.67 to -0.38) | <.001 |
| Conservative | -0.81 (-0.96 to -0.66) | <.001 |
| Race | ||
| White | 1 [Reference] | NA |
| Black | 0.22 (0.12 to 0.32) | <.001 |
| Other b | 0.53 (0.36 to 0.70) | <.001 |
| ≥2 Races | 0.24 (0.01 to 0.47) | .04 |
| Ethnicity | ||
| Non-Hispanic | 1 [Reference] | NA |
| Hispanic | 0.38 (0.28 to 0.48) | <.001 |
| Household income, $ | ||
| ≤24 999 | 1 [Reference] | NA |
| 25 000-49 999 | -0.04 (-0.17 to 0.10) | .61 |
| 50 000-99 999 | -0.23 (-0.35 to -0.11) | <.001 |
| ≥100 000 | -0.09 (-0.22 to 0.03) | .14 |
| Region | ||
| Northeast | 1 [Reference] | NA |
| Midwest | -0.06 (-0.21 to 0.09) | .41 |
| South | 0.00 (-0.15 to 0.15) | .99 |
| West | 0.00 (-0.15 to 0.15) | .98 |
| Age, y | ||
| 18-29 | 1 [Reference] | NA |
| 30-44 | 0.07 (-0.06 to 0.19) | .30 |
| 45-59 | 0.03 (-0.09 to 0.15) | .65 |
| ≥60 | 0.13 (0.01 to 0.25) | .03 |
| Family history of COVID-19 | ||
| Yes | 1 [Reference] | NA |
| No | 0.00 (-0.25 to 0.25) | .99 |
| COVID-19 incidence rate | ||
| Quartile 1 | 1 [Reference] | NA |
| Quartile 2 | -0.08 (-0.21 to 0.05) | .22 |
| Quartile 3 | -0.18 (-0.32 to -0.04) | .01 |
| Quartile 4 | -0.02 (-0.16 to 0.13) | .80 |
| Residence type | ||
| Nonmetropolitan | 1 [Reference] | NA |
| Metropolitan | 0.13 (0.00 to 0.25) | .05 |
| Framing | ||
| Individual level | 1 [Reference] | NA |
| Population level | -0.08 (-0.21 to 0.05) | .21 |
| Factor main effects | ||
| Social media scenarios | 1 [Reference] | NA |
| Smart thermometer scenarios | 0.09 (0.03 to 0.16) | .004 |
| Smartphone scenarios | 0.29 (0.23 to 0.35) | <.001 |
| Interaction terms | ||
| Population-level framing × political ideology | ||
| Liberal | 1 [Reference] | NA |
| Moderate | 0.21 (0.02 to 0.39) | .03 |
| Conservative | 0.09 (-0.11 to 0.29) | .38 |
(continued)
JAMA Network Open. 2021;4(5):e2110918. doi:10.1001/jamanetworkopen.2021.10918
May 19, 2021 9/15
Downloaded From: https://jamanetwork.com/ by a Non-Human Traffic (NHT) User on 08/22/2021