 Talk to Sales
 Benchmarks
View scores and output across OCR models spanning many document categories.
Want to run these evals on your own documents?
Talk to Sales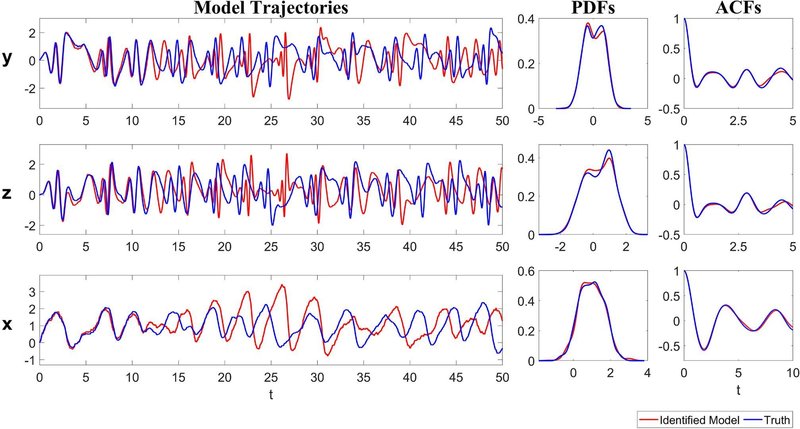
Model Trajectories

Plot of Model Trajectories for variable versus time (0 to 50). The -axis ranges from -2 to 2. Two highly oscillatory time series are shown: the Identified Model (Red) and the Truth (Blue). The two trajectories are visually similar, indicating a good fit.

Plot of Model Trajectories for variable versus time (0 to 50). The -axis ranges from -2 to 2. Two highly oscillatory time series are shown: the Identified Model (Red) and the Truth (Blue). The two trajectories are visually similar, indicating a good fit.

Plot of Model Trajectories for variable versus time (0 to 50). The -axis ranges from -1 to 3. Two oscillatory time series are shown: the Identified Model (Red) and the Truth (Blue). The two trajectories are visually similar, indicating a good fit.
PDFs

Plot of Probability Density Functions (PDFs) for variable . The horizontal axis ranges from -5 to 5, and the vertical axis ranges from 0 to 0.4. The Identified Model (Red) and Truth (Blue) PDFs are nearly identical, showing a bimodal distribution centered around 0.
ACFs

Plot of Autocorrelation Functions (ACFs) for variable . The horizontal axis (lag time) ranges from 0 to 5, and the vertical axis (ACF value) ranges from -0.5 to 1. The Identified Model (Red) and Truth (Blue) ACFs are nearly identical, showing significant correlation at lag 0 and decaying oscillations.

Plot of Probability Density Functions (PDFs) for variable . The horizontal axis ranges from -2 to 2, and the vertical axis ranges from 0 to 0.4. The Identified Model (Red) and Truth (Blue) PDFs are nearly identical, centered around 0.

Plot of Autocorrelation Functions (ACFs) for variable . The horizontal axis (lag time) ranges from 0 to 5, and the vertical axis (ACF value) ranges from -0.5 to 1. The Identified Model (Red) and Truth (Blue) ACFs are nearly identical, showing significant correlation at lag 0 and decaying oscillations.

Plot of Probability Density Functions (PDFs) for variable . The horizontal axis ranges from 0 to 4, and the vertical axis ranges from 0 to 0.6. The Identified Model (Red) and Truth (Blue) PDFs are nearly identical, centered around 1.

Plot of Autocorrelation Functions (ACFs) for variable . The horizontal axis (lag time) ranges from 0 to 10, and the vertical axis (ACF value) ranges from -0.5 to 1. The Identified Model (Red) and Truth (Blue) ACFs are nearly identical, showing significant correlation at lag 0 and decaying oscillations.
Identified Model — Truth