 Talk to Sales
 Benchmarks
View scores and output across OCR models spanning many document categories.
Want to run these evals on your own documents?
Talk to Sales Page 1 of 1
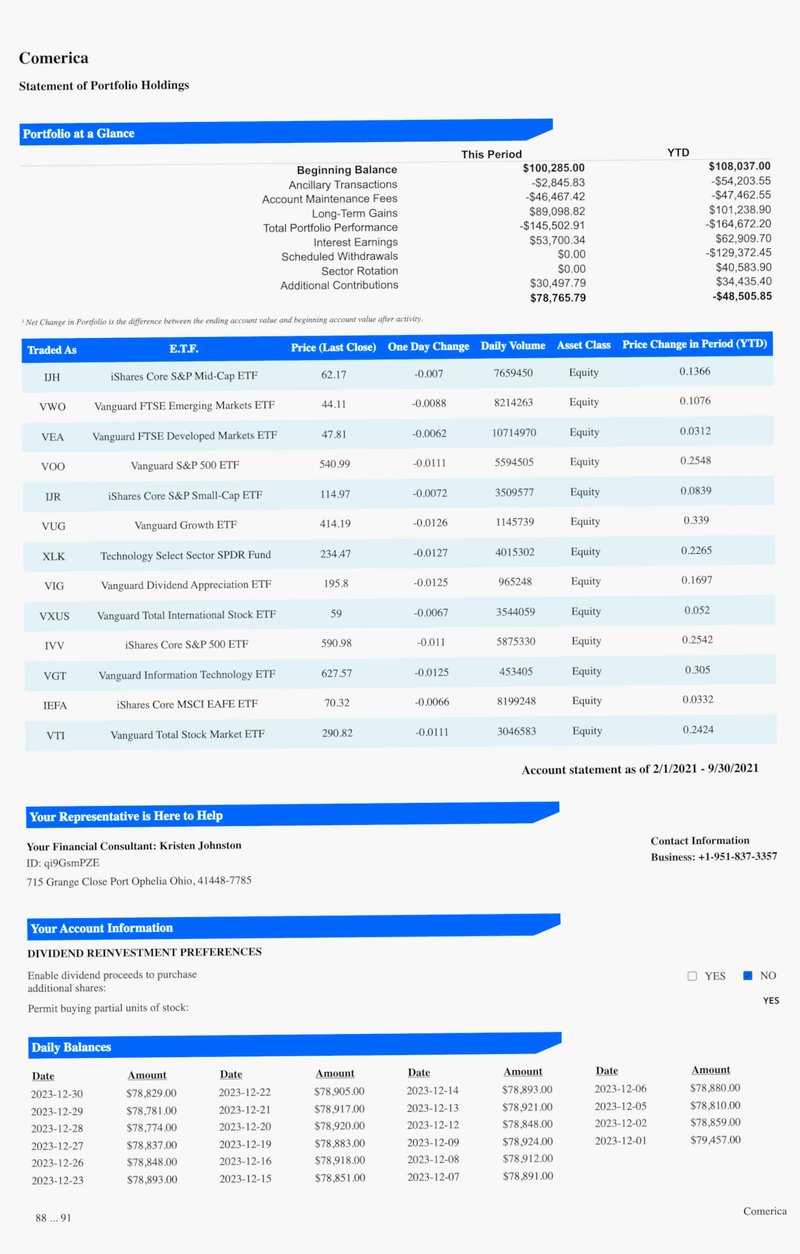
Comerica
Statement of Portfolio Holdings
Portfolio at a Glance
| This Period | YTD | |
|---|---|---|
| Beginning Balance | $100,285.00 | $108,037.00 |
| Ancillary Transactions | -$2,845.83 | -$54,203.55 |
| Account Maintenance Fees | -$46,467.42 | -$47,462.55 |
| Long-Term Gains | $89,098.82 | $101,238.90 |
| Total Portfolio Performance | -$145,502.91 | -$164,672.20 |
| Interest Earnings | $53,700.34 | $62,909.70 |
| Scheduled Withdrawals | $0.00 | -$129,372.45 |
| Sector Rotation | $0.00 | $40,583.90 |
| Additional Contributions | $30,497.79 | $34,435.40 |
| $78,765.79 | -$48,505.85 |
* Net Change in Portfolio is the difference between the ending account value and beginning account value after activity.
| Traded As | E.T.F. | Price (Last Close) | One Day Change | Daily Volume | Asset Class | Price Change in Period (YTD) |
|---|---|---|---|---|---|---|
| IJH | iShares Core S&P Mid-Cap ETF | 62.17 | -0.007 | 7659450 | Equity | 0.1366 |
| VWO | Vanguard FTSE Emerging Markets ETF | 44.11 | -0.0088 | 8214263 | Equity | 0.1076 |
| VEA | Vanguard FTSE Developed Markets ETF | 47.81 | -0.0062 | 10714970 | Equity | 0.0312 |
| VOO | Vanguard S&P 500 ETF | 540.99 | -0.0111 | 5594505 | Equity | 0.2548 |
| IJR | iShares Core S&P Small-Cap ETF | 114.97 | -0.0072 | 3509577 | Equity | 0.0839 |
| VUG | Vanguard Growth ETF | 414.19 | -0.0126 | 1145739 | Equity | 0.339 |
| XLK | Technology Select Sector SPDR Fund | 234.47 | -0.0127 | 4015302 | Equity | 0.2265 |
| VIG | Vanguard Dividend Appreciation ETF | 195.8 | -0.0125 | 965248 | Equity | 0.1697 |
| VXUS | Vanguard Total International Stock ETF | 59 | -0.0067 | 3544059 | Equity | 0.052 |
| IVV | iShares Core S&P 500 ETF | 590.98 | -0.011 | 5875330 | Equity | 0.2542 |
| VGT | Vanguard Information Technology ETF | 627.57 | -0.0125 | 453405 | Equity | 0.305 |
| IEFA | iShares Core MSCI EAFE ETF | 70.32 | -0.0066 | 8199248 | Equity | 0.0332 |
| VTI | Vanguard Total Stock Market ETF | 290.82 | -0.0111 | 3046583 | Equity | 0.2424 |
Account statement as of 2/1/2021 - 9/30/2021
Your Representative is Here to Help
Your Financial Consultant: Kristen Johnston
ID: qi9GsmPZE
715 Grange Close Port Ophelia Ohio, 41448-7785
Contact Information
Business: +1-951-837-3357
Your Account Information
DIVIDEND REINVESTMENT PREFERENCES
Enable dividend proceeds to purchase additional shares:
YES NO
Permit buying partial units of stock:
YES NO
Daily Balances
| Date | Amount | Date | Amount | Date | Amount | Date | Amount |
|---|---|---|---|---|---|---|---|
| 2023-12-30 | $78,829.00 | 2023-12-22 | $78,905.00 | 2023-12-14 | $78,893.00 | 2023-12-06 | $78,880.00 |
| 2023-12-29 | $78,781.00 | 2023-12-21 | $78,917.00 | 2023-12-13 | $78,921.00 | 2023-12-05 | $78,810.00 |
| 2023-12-28 | $78,774.00 | 2023-12-20 | $78,920.00 | 2023-12-12 | $78,848.00 | 2023-12-02 | $78,859.00 |
| 2023-12-27 | $78,837.00 | 2023-12-19 | $78,883.00 | 2023-12-09 | $78,924.00 | 2023-12-01 | $79,457.00 |
| 2023-12-26 | $78,848.00 | 2023-12-16 | $78,918.00 | 2023-12-08 | $78,912.00 | ||
| 2023-12-23 | $78,893.00 | 2023-12-15 | $78,851.00 | 2023-12-07 | $78,891.00 |
88 ... 91
Comerica