 Talk to Sales
 Benchmarks
View scores and output across OCR models spanning many document categories.
Want to run these evals on your own documents?
Talk to Sales Page 1 of 1
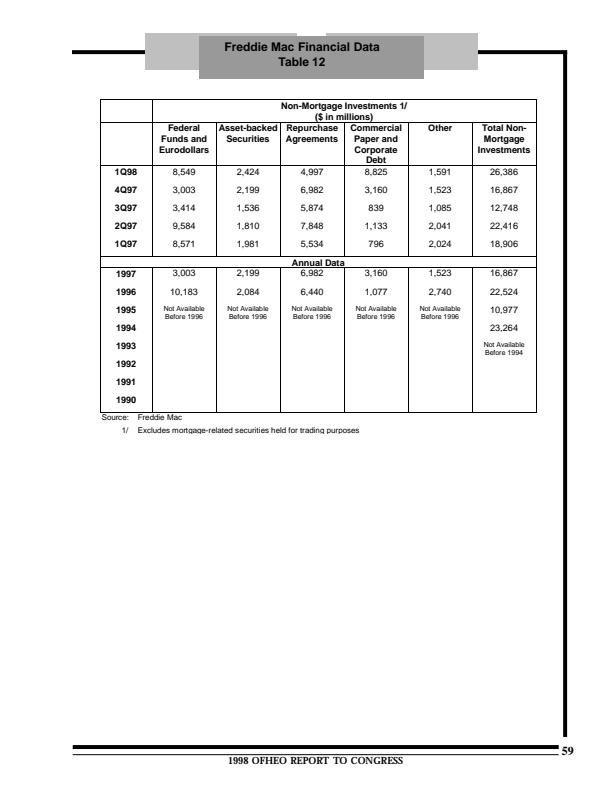
Freddie Mac Financial Data
Table 12
|
Non-Mortgage Investments 1/
($ in millions) |
||||||
|---|---|---|---|---|---|---|
|
Federal
Funds and Eurodollars |
Asset-backed
Securities |
Repurchase
Agreements |
Commercial
Paper and Corporate Debt |
Other |
Total Non-
Mortgage Investments |
|
| 1Q98 | 8,549 | 2,424 | 4,997 | 8,825 | 1,591 | 26,386 |
| 4Q97 | 3,003 | 2,199 | 6,982 | 3,160 | 1,523 | 16,867 |
| 3Q97 | 3,414 | 1,536 | 5,874 | 839 | 1,085 | 12,748 |
| 2Q97 | 9,584 | 1,810 | 7,848 | 1,133 | 2,041 | 22,416 |
| 1Q97 | 8,571 | 1,981 | 5,534 | 796 | 2,024 | 18,906 |
| Annual Data | ||||||
| 1997 | 3,003 | 2,199 | 6,982 | 3,160 | 1,523 | 16,867 |
| 1996 | 10,183 | 2,084 | 6,440 | 1,077 | 2,740 | 22,524 |
| 1995 |
Not Available
Before 1996 |
Not Available
Before 1996 |
Not Available
Before 1996 |
Not Available
Before 1996 |
Not Available
Before 1996 |
10,977 |
| 1994 | 23,264 | |||||
| 1993 |
Not Available
Before 1994 |
|||||
| 1992 | ||||||
| 1991 | ||||||
| 1990 | ||||||
Source: Freddie Mac
1/ Excludes mortgage-related securities held for trading purposes
1998 OFHEO REPORT TO CONGRESS
59