 Talk to Sales
 Benchmarks
View scores and output across OCR models spanning many document categories.
Want to run these evals on your own documents?
Talk to Sales Page 1 of 1
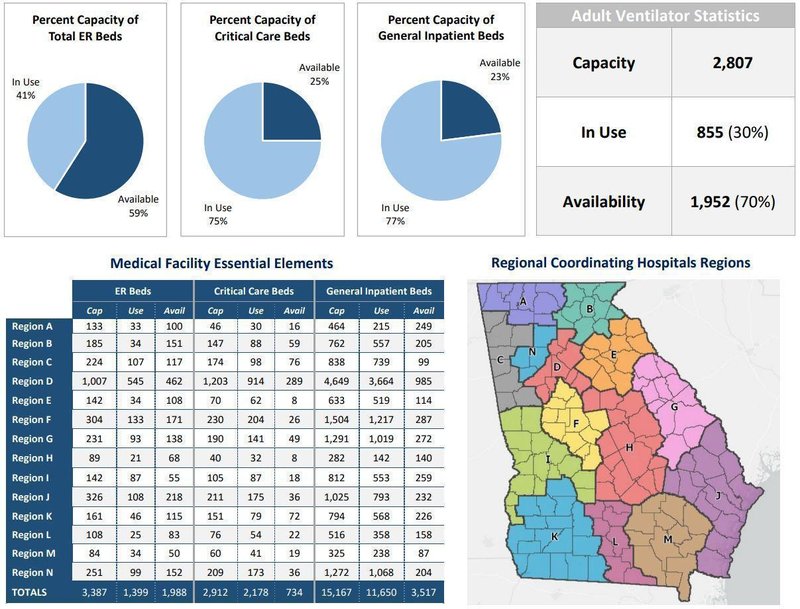
Percent Capacity of Total ER Beds

Pie chart showing ER Bed Capacity:
- In Use: 41%
- Available: 59%
Percent Capacity of Critical Care Beds

Pie chart showing Critical Care Bed Capacity:
- In Use: 75%
- Available: 25%
Percent Capacity of General Inpatient Beds

Pie chart showing General Inpatient Bed Capacity:
- In Use: 77%
- Available: 23%
Adult Ventilator Statistics
| Capacity | 2,807 |
| In Use | 855 (30%) |
| Availability | 1,952 (70%) |
Medical Facility Essential Elements
| ER Beds | Critical Care Beds | General Inpatient Beds | |||||||
|---|---|---|---|---|---|---|---|---|---|
| Cap | Use | Avail | Cap | Use | Avail | Cap | Use | Avail | |
| Region A | 133 | 33 | 100 | 46 | 30 | 16 | 464 | 215 | 249 |
| Region B | 185 | 34 | 151 | 147 | 88 | 59 | 762 | 557 | 205 |
| Region C | 224 | 107 | 117 | 174 | 98 | 76 | 838 | 739 | 99 |
| Region D | 1,007 | 545 | 462 | 1,203 | 914 | 289 | 4,649 | 3,664 | 985 |
| Region E | 142 | 34 | 108 | 70 | 62 | 8 | 633 | 519 | 114 |
| Region F | 304 | 133 | 171 | 230 | 204 | 26 | 1,504 | 1,217 | 287 |
| Region G | 231 | 93 | 138 | 190 | 141 | 49 | 1,291 | 1,019 | 272 |
| Region H | 89 | 21 | 68 | 40 | 32 | 8 | 282 | 142 | 140 |
| Region I | 142 | 87 | 55 | 105 | 87 | 18 | 812 | 553 | 259 |
| Region J | 326 | 108 | 218 | 211 | 175 | 36 | 1,025 | 793 | 232 |
| Region K | 161 | 46 | 115 | 151 | 79 | 72 | 794 | 568 | 226 |
| Region L | 108 | 25 | 83 | 76 | 54 | 22 | 516 | 358 | 158 |
| Region M | 84 | 34 | 50 | 60 | 41 | 19 | 325 | 238 | 87 |
| Region N | 251 | 99 | 152 | 209 | 173 | 36 | 1,272 | 1,068 | 204 |
| TOTALS | 3,387 | 1,399 | 1,988 | 2,912 | 2,178 | 734 | 15,167 | 11,650 | 3,517 |
Regional Coordinating Hospitals Regions

Map of Georgia showing 14 Regional Coordinating Hospitals Regions (A through N) colored differently.