 Talk to Sales
 Benchmarks
View scores and output across OCR models spanning many document categories.
Want to run these evals on your own documents?
Talk to Sales Page 1 of 1
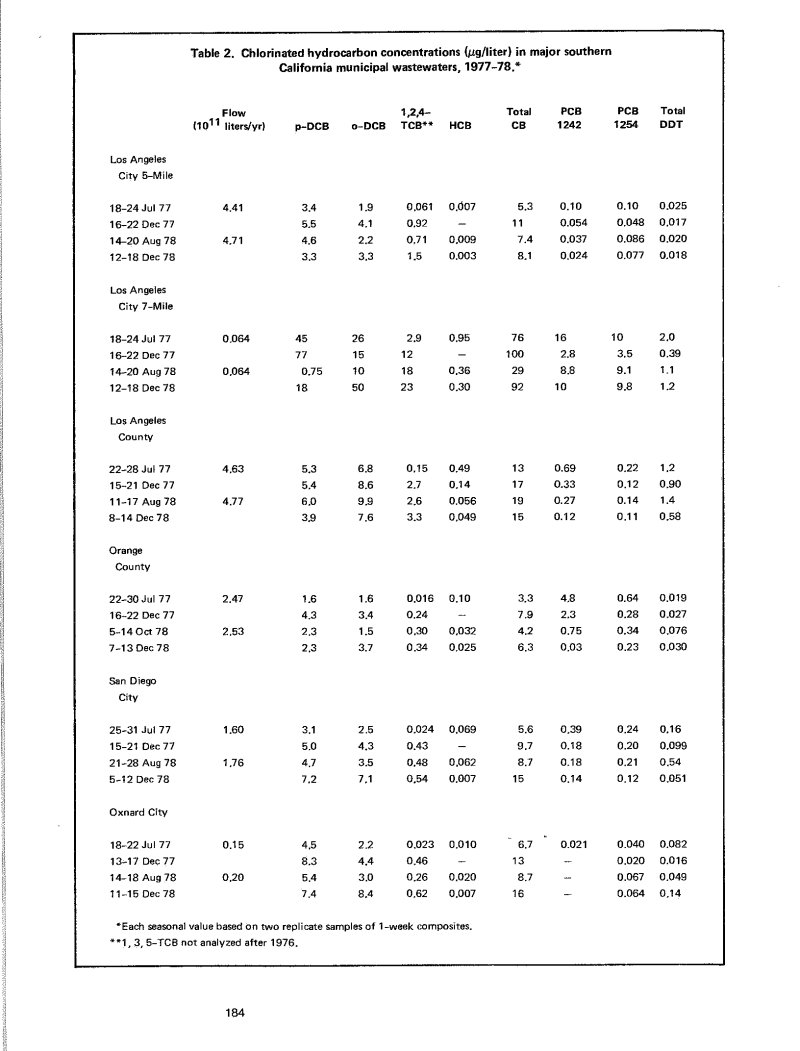
Table 2. Chlorinated hydrocarbon concentrations (
) in major southern California municipal wastewaters, 1977–78.*
|
Flow
( liters/yr) |
p-DCB | o-DCB |
1,2,4-
TCB** |
HCB |
Total
CB |
PCB
1242 |
PCB
1254 |
Total
DDT |
|
|---|---|---|---|---|---|---|---|---|---|
| Los Angeles | |||||||||
| City 5-Mile | |||||||||
| 18-24 Jul 77 | 4.41 | 3.4 | 1.9 | 0.061 | 0.007 | 5.3 | 0.10 | 0.10 | 0.025 |
| 16-22 Dec 77 | 5.5 | 4.1 | 0.92 | — | 11 | 0.054 | 0.048 | 0.017 | |
| 14-20 Aug 78 | 4.71 | 4.6 | 2.2 | 0.71 | 0.009 | 7.4 | 0.037 | 0.086 | 0.020 |
| 12-18 Dec 78 | 3.3 | 3.3 | 1.5 | 0.003 | 8.1 | 0.024 | 0.077 | 0.018 | |
| City 7-Mile | |||||||||
| 18-24 Jul 77 | 0.064 | 45 | 26 | 2.9 | 0.95 | 76 | 16 | 10 | 2.0 |
| 16-22 Dec 77 | 77 | 15 | 12 | — | 100 | 2.8 | 3.5 | 0.39 | |
| 14-20 Aug 78 | 0.064 | 0.75 | 10 | 18 | 0.36 | 29 | 8.8 | 9.1 | 1.1 |
| 12-18 Dec 78 | 18 | 50 | 23 | 0.30 | 92 | 10 | 9.8 | 1.2 | |
| County | |||||||||
| 22-28 Jul 77 | 4.63 | 5.3 | 6.8 | 0.15 | 0.49 | 13 | 0.69 | 0.22 | 1.2 |
| 15-21 Dec 77 | 5.4 | 8.6 | 2.7 | 0.14 | 17 | 0.33 | 0.12 | 0.90 | |
| 11-17 Aug 78 | 4.77 | 6.0 | 9.9 | 2.6 | 0.056 | 19 | 0.27 | 0.14 | 1.4 |
| 8-14 Dec 78 | 3.9 | 7.6 | 3.3 | 0.049 | 15 | 0.12 | 0.11 | 0.58 | |
| Orange | |||||||||
| County | |||||||||
| 22-30 Jul 77 | 2.47 | 1.6 | 1.6 | 0.016 | 0.10 | 3.3 | 4.8 | 0.64 | 0.019 |
| 16-22 Dec 77 | 4.3 | 3.4 | 0.24 | — | 7.9 | 2.3 | 0.28 | 0.027 | |
| 5-14 Oct 78 | 2.53 | 2.3 | 1.5 | 0.30 | 0.032 | 4.2 | 0.75 | 0.34 | 0.076 |
| 7-13 Dec 78 | 2.3 | 3.7 | 0.34 | 0.025 | 6.3 | 0.03 | 0.23 | 0.030 | |
| San Diego | |||||||||
| City | |||||||||
| 25-31 Jul 77 | 1.60 | 3.1 | 2.5 | 0.024 | 0.069 | 5.6 | 0.39 | 0.24 | 0.16 |
| 15-21 Dec 77 | 5.0 | 4.3 | 0.43 | — | 9.7 | 0.18 | 0.20 | 0.099 | |
| 21-28 Aug 78 | 1.76 | 4.7 | 3.5 | 0.48 | 0.062 | 8.7 | 0.18 | 0.21 | 0.54 |
| 5-12 Dec 78 | 7.2 | 7.1 | 0.54 | 0.007 | 15 | 0.14 | 0.12 | 0.051 | |
| Oxnard City | |||||||||
| 18-22 Jul 77 | 0.15 | 4.5 | 2.2 | 0.023 | 0.010 | 6.7 | 0.021 | 0.040 | 0.082 |
| 13-17 Dec 77 | 8.3 | 4.4 | 0.46 | — | 13 | — | 0.020 | 0.016 | |
| 14-18 Aug 78 | 0.20 | 5.4 | 3.0 | 0.26 | 0.020 | 8.7 | — | 0.067 | 0.049 |
| 11-15 Dec 78 | 7.4 | 8.4 | 0.62 | 0.007 | 16 | — | 0.064 | 0.14 | |
*Each seasonal value based on two replicate samples of 1-week composites.
**1, 3, 5-TCB not analyzed after 1976.
184