 Talk to Sales
 Benchmarks
View scores and output across OCR models spanning many document categories.
Want to run these evals on your own documents?
Talk to Sales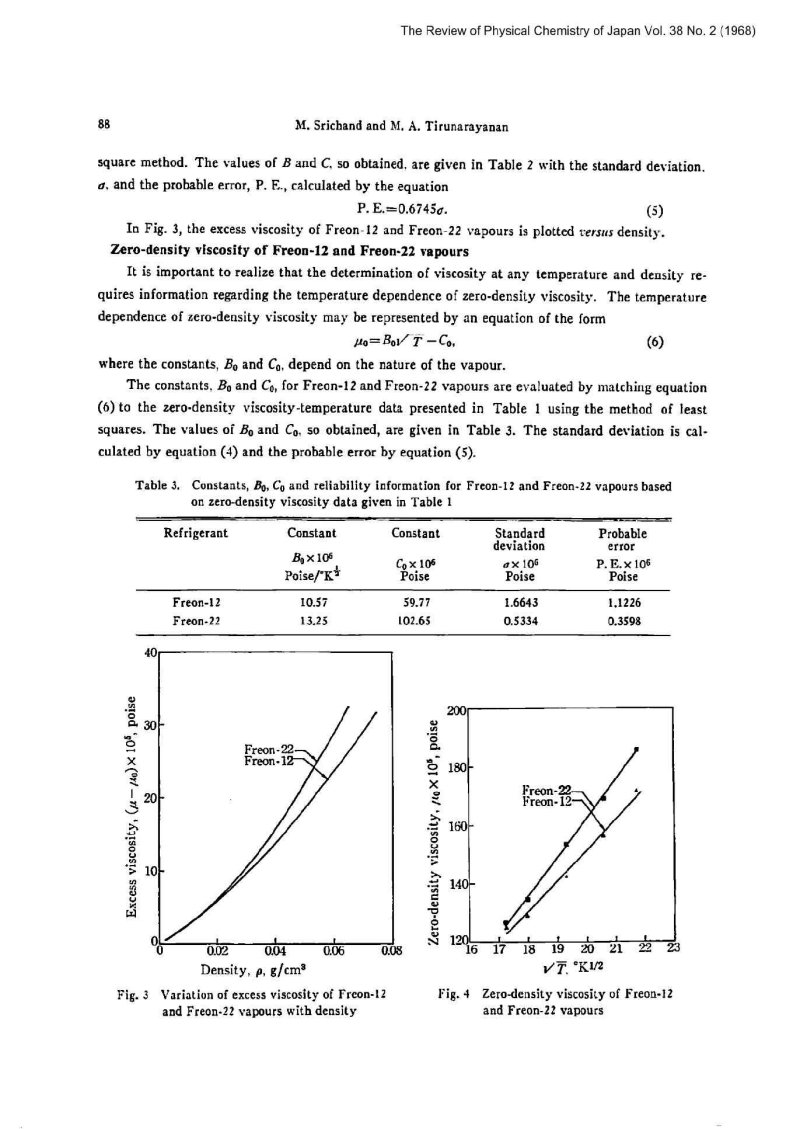
The Review of Physical Chemistry of Japan Vol. 38 No. 2 (1968)
88
M. Srichand and M. A. Tirunarayanan
square method. The values of and , so obtained, are given in Table 2 with the standard deviation, , and the probable error, P. E., calculated by the equation
In Fig. 3, the excess viscosity of Freon-12 and Freon-22 vapours is plotted versus density.
Zero-density viscosity of Freon-12 and Freon-22 vapours
It is important to realize that the determination of viscosity at any temperature and density requires information regarding the temperature dependence of zero-density viscosity. The temperature dependence of zero-density viscosity may be represented by an equation of the form
where the constants, and , depend on the nature of the vapour.
The constants, and , for Freon-12 and Freon-22 vapours are evaluated by matching equation (6) to the zero-density viscosity-temperature data presented in Table 1 using the method of least squares. The values of and , so obtained, are given in Table 3. The standard deviation is calculated by equation (4) and the probable error by equation (5).
Table 3. Constants, , and reliability information for Freon-12 and Freon-22 vapours based on zero-density viscosity data given in Table 1
| Refrigerant | Constant | Constant | Standard deviation | Probable error |
|---|---|---|---|---|
|
Poise/ |
Poise |
Poise |
P. E.
Poise |
|
| Freon-12 | 10.57 | 59.77 | 1.6643 | 1.1226 |
| Freon-22 | 13.25 | 102.65 | 0.5334 | 0.3598 |

Fig. 3 Variation of excess viscosity of Freon-12 and Freon-22 vapours with density

Fig. 4 Zero-density viscosity of Freon-12 and Freon-22 vapours